
Freudly+971 508685814hello@freudly.ai
Freudly
cbt

Leahy Emotional Schema Scale II (LESS II) Test
Take the online Leahy Emotional Schema Scale II (LESS II) Test - AI psychologist FreudlyYou can take Leahy Emotional Schema Scale II (LESS II) Testhere. Online version of a simple and accurate psychological test with interpretation.en
Understand your emotional beliefs and coping patterns in about 6 minutes. This 28 item scale pinpoints unhelpful schemas like self criticism and avoidance to guide more targeted therapy.
Start Online Test
Questions: 286 minutes
08:30
October 2, 2025
October 2, 2025
Material has been updated
October 2, 2025
Material has been published
17,176 views
1,439 completions
1,219 likes
Verified by Daniel Hall
Psychologist with 25 years of experience
Share
Scale Explorer

How the Scales are Structured

example score
5/12
Blame (B)
Measures the tendency to attribute one’s emotions to other people’s actions or inactions rather than to internal factors.
Low blaming
Moderate blaming
High blaming
26: Low blaming | 78: Moderate blaming | 912: High blaming
A score of 5 falls in the Low blaming range, suggesting you generally do not rely on blaming others to explain your emotional experiences.
example score
4/12
Low Emotional Expression (LEE)
Measures how strongly a person tends to experience and display emotions with reduced intensity or expressiveness.
Low
Elevated
27: Low | 812: Elevated
A score of 4 falls in the Low range, suggesting generally typical emotional intensity/expressiveness with minimal indication of muted emotional display.
example score
8/12
Emotional Nonacceptance (EN)
Measures the degree to which a person views certain emotions as unacceptable and tends to avoid or suppress them.
Low rejection
High rejection
27: Low rejection | 812: High rejection
A score of 8 falls in the High rejection range, suggesting a stronger tendency to judge some feelings as unacceptable and to try to push them away rather than allow them.
example score
10/12
Rumination (R)
Measures the tendency to repeatedly dwell on and analyze negative emotions rather than letting them pass.
Low
Moderate
High
27: Low | 89: Moderate | 1012: High
A score of 10 falls in the High range, suggesting a strong tendency to return to negative feelings and mentally replay them, which can make emotional recovery slower.
example score
4/12
Low Consensus (LC)
Low consensus measures the extent to which a person believes their emotional experiences are unique and not shared or understood by others.
Low
High
27: Low | 812: High
A score of 4 falls in the Low range, suggesting you are less likely to view your emotions as uniquely isolating and may find it easier to feel understood by others.
example score
6/12
Duration (D)
Duration measures the belief that negative emotions will persist for a long time and be slow to pass.
Low
Moderate
High
26: Low | 7: Moderate | 812: High
A score of 6 falls in the Low range, suggesting a relatively limited expectation that negative emotions will last a very long time.
example score
8/12
Excessive Rationality (ER)
Measures the tendency to rely on logic and control while minimizing or avoiding emotional experience and expression.
Low
High
27: Low | 812: High
A score of 8 falls in the High range, suggesting a stronger-than-average preference for rational control that may limit emotional openness and full processing of feelings.
example score
7/12
Emotional Numbness (EN)
Measures the extent to which a person experiences their emotions as absent, muted, or hard to recognize and express.
Low numbness
Elevated numbness
27: Low numbness | 812: Elevated numbness
A score of 7 indicates low emotional numbness, suggesting emotions are generally present and identifiable, though they may feel muted at times.
example score
4/12
Loss of Control (LoC)
Measures the belief that emotions must be tightly controlled to prevent them from becoming overwhelming or unmanageable.
Low
Moderate
High
26: Low | 7: Moderate | 812: High
A score of 4 falls in the Low range, suggesting relatively little concern that emotions will spiral out of control if not strictly managed.
example score
6/12
Devaluation (D)
Devaluation measures the extent to which a person believes emotions are unimportant or unrelated to their personal values and needs.
Low devaluation
Moderate devaluation
High devaluation
26: Low devaluation | 78: Moderate devaluation | 912: High devaluation
A score of 6 suggests low devaluation, meaning you generally see emotions as relevant and potentially informative rather than dismissing them.
example score
9/12
Simplistic View (SV)
Measures the tendency to view emotions in an overly simple, one-dimensional way, making it harder to tolerate mixed or conflicting feelings.
Nuanced view
Simplified view
27: Nuanced view | 812: Simplified view
A score of 9 suggests a stronger tendency to simplify emotional experiences, which can make complex or mixed feelings feel confusing and easier to avoid.
example score
5/12
Guilt And Shame (GAS)
Measures the degree to which a person associates emotions with personal weakness, leading to guilt/shame and increased self-criticism.
Low
Elevated
27: Low | 812: Elevated
A score of 5 falls in the Low range, suggesting relatively little tendency to interpret emotions as a sign of weakness or to respond with guilt/shame.
example score
8/12
Incomprehensibility (I)
Uncertainty measures how confusing, meaningless, or chaotic your emotions feel to you.
Low uncertainty
High uncertainty
27: Low uncertainty | 812: High uncertainty
A score of 8 falls in the high uncertainty range, suggesting emotions may often feel hard to interpret or make sense of.
example score
8/12
Invalidation (I)
Invalidation measures the extent to which a person believes others do not understand, accept, or value their emotional experiences.
Low
High
27: Low | 812: High
A score of 8 falls in the High range, suggesting a stronger expectation that others will dismiss or misunderstand your feelings, which may make emotional sharing and support-seeking feel less rewarding.
example score
138/168
Overall Level of Emotional Schemas (OLoES)
Measures the overall intensity of emotional schemas, reflecting how strongly beliefs and strategies shape understanding, acceptance, and expression of emotions.
Low
Moderate
High
2874: Low | 75121: Moderate | 122168: High
A score of 138 falls in the High range, suggesting a strong overall influence of maladaptive emotional schemas that may be associated with greater difficulty accepting, making sense of, or expressing emotions.
Start Online Test
just completed the test
DATA-BASED USER COHORTS

Who Usually Takes This Test?

Therapy clients feeling stuck
41%OF USERS
People in counseling who keep looping in anxiety, shame, or sadness and want to understand the beliefs and habits that maintain those feelings.
CBT therapists and trainees
35%OF USERS
Mental health professionals who use the scale to quickly map emotion-related schemas and plan more targeted interventions.
Self-critical emotion avoiders
24%OF USERS
Individuals who judge their emotions harshly, fear vulnerability, or try to suppress feelings and want a clearer picture of their emotional patterns.
BASED ON AGGREGATED, ANONYMIZED DATA FROM TENS OF THOUSANDS OF FREUDLY USERS.
Benchmarking

See How You Compare

Once you complete the test, your results are compared with real-world data from people in your country.
Below is a preview of how scores are typically distributed across each scale.
Accusation (A)
Accusation (A)
Average
5.5
Normal range
4.16.9
min.
2
max.
12
This curve shows how scores are typically distributed.
Once you complete the test, your result will appear on the scale so you can see how you compare.
Low Emotional Intensity (LEI)
Average
8.9
Normal range
7.710.1
min.
2
max.
12
This curve shows how scores are typically distributed.
Once you complete the test, your result will appear on the scale so you can see how you compare.
Rejection of Feelings (RoF)
Average
7.7
Normal range
6.39
min.
2
max.
12
This curve shows how scores are typically distributed.
Once you complete the test, your result will appear on the scale so you can see how you compare.
Rumination (R)
Rumination (R)
Average
8.9
Normal range
7.510.2
min.
2
max.
12
This curve shows how scores are typically distributed.
Once you complete the test, your result will appear on the scale so you can see how you compare.
Low consensus (Lc)
Low consensus (Lc)
Average
6.6
Normal range
4.78.5
min.
2
max.
12
This curve shows how scores are typically distributed.
Once you complete the test, your result will appear on the scale so you can see how you compare.
Duration (D)
Duration (D)
Average
5.2
Normal range
3.66.9
min.
2
max.
12
This curve shows how scores are typically distributed.
Once you complete the test, your result will appear on the scale so you can see how you compare.
Excessive Rationality (ER)
Average
6.5
Normal range
4.88.2
min.
2
max.
12
This curve shows how scores are typically distributed.
Once you complete the test, your result will appear on the scale so you can see how you compare.
Emotional numbness (En)
Average
5.2
Normal range
3.76.8
min.
2
max.
12
This curve shows how scores are typically distributed.
Once you complete the test, your result will appear on the scale so you can see how you compare.
Loss of Control (LoC)
Average
9.1
Normal range
7.910.4
min.
2
max.
12
This curve shows how scores are typically distributed.
Once you complete the test, your result will appear on the scale so you can see how you compare.
Devaluation (D)
Devaluation (D)
Average
8
Normal range
6.49.5
min.
2
max.
12
This curve shows how scores are typically distributed.
Once you complete the test, your result will appear on the scale so you can see how you compare.
Simplified View (SV)
Average
9.3
Normal range
7.611
min.
2
max.
12
This curve shows how scores are typically distributed.
Once you complete the test, your result will appear on the scale so you can see how you compare.
Guilt and Shame (GaS)
Average
8.8
Normal range
7.410.2
min.
2
max.
12
This curve shows how scores are typically distributed.
Once you complete the test, your result will appear on the scale so you can see how you compare.
Uncertainty (U)
Uncertainty (U)
Average
8.9
Normal range
7.210.6
min.
2
max.
12
This curve shows how scores are typically distributed.
Once you complete the test, your result will appear on the scale so you can see how you compare.
Invalidation (I)
Invalidation (I)
Average
5.1
Normal range
3.86.4
min.
2
max.
12
This curve shows how scores are typically distributed.
Once you complete the test, your result will appear on the scale so you can see how you compare.
Overall Level of Emotional Schemas (OLoES)
Average
72.5
Normal range
49.295.9
min.
28
max.
168
This curve shows how scores are typically distributed.
Once you complete the test, your result will appear on the scale so you can see how you compare.
Featured On
SAMPLE QUESTIONS

Example Questions From the Test

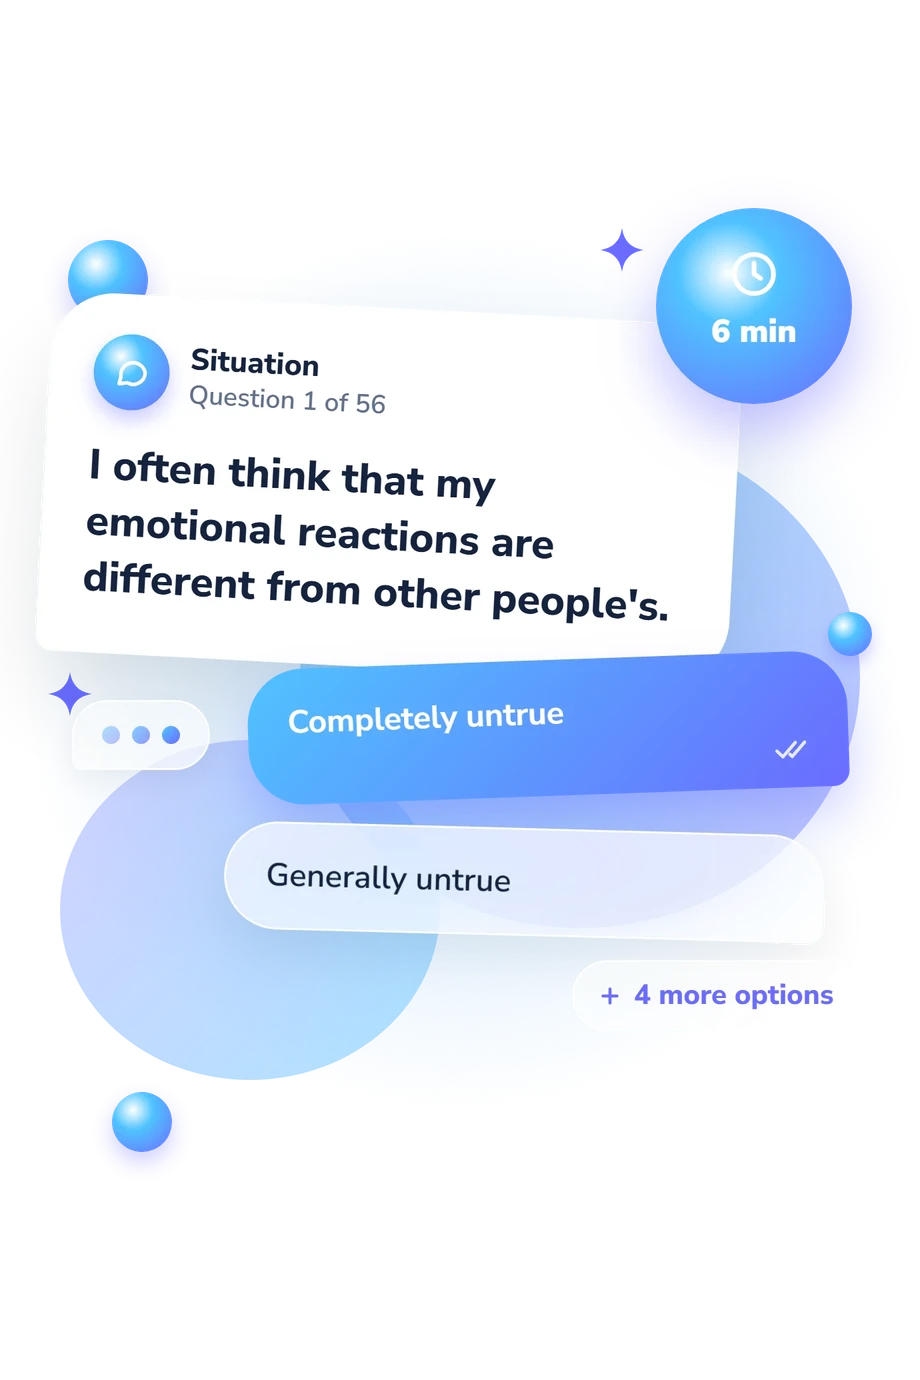
It can be helpful to understand how a person copes with different feelings and emotions, such as anger, sadness, anxiety, and sexual desire. People respond to these experiences in different ways; therefore, there are no right or wrong answers. Please read each statement carefully and indicate the extent to which it accurately or inaccurately describes you and how you have managed your feelings over the past month.
    • Completely untrue
    • Generally untrue
    • Not quite true
    • Mostly true
    • Generally true
    • Completely true
    • Completely untrue
    • Mostly untrue
    • Somewhat untrue
    • Somewhat true
    • Mostly true
    • Completely true
    • Absolutely untrue
    • Generally untrue
    • Not quite true
    • Mostly true
    • Generally true
    • Absolutely true
WHAT THE TEST MEASURES
About This Assessment
Lihi's Emotional Schemas Scale, LESS II Test

Leahy Emotional Schema Scale II (LESS II) Test - Symptoms and Signs

cbt
schematherapy

This measure is designed to assess how individuals understand, evaluate, and respond to their own emotional experiences. The Leahy Emotional Schema Scale II (LESS II) is commonly used to clarify beliefs and expectations about emotions that may shape coping and emotion regulation.

The instrument consists of 28 items and typically takes about 6 minutes to complete. Item content reflects attitudes toward emotions (e.g., acceptance, self-criticism, fear of certain feelings, perceived controllability) and can help identify patterns that may contribute to avoidance, suppression, or difficulty tolerating distress. Developed by Robert L. Leahy, the Leahy Emotional Schema Scale II (LESS II) is intended to support clinical formulation and treatment planning by highlighting emotion-related schemas that may be relevant targets for intervention.

Author: Robert L. Leahy
Literature: Leahy, R. L. Emotional schema therapy. In J. S. Beck (Ed.), Cognitive behavior therapy: Basics and beyond. Guilford Press. 2011.; Leahy, R. L. Emotional schema therapy: Distinctive features. Routledge. 2015.; Beck, J. S. Cognitive behavior therapy: Basics and beyond. Guilford Press. 2011.
Popular tests
Comments
Leave a Comment