
Burnout Assessment Tool (BAT) Test
How the Scales are Structured
Who Usually Takes This Test?
See How You Compare
Below is a preview of how scores are typically distributed across each scale.
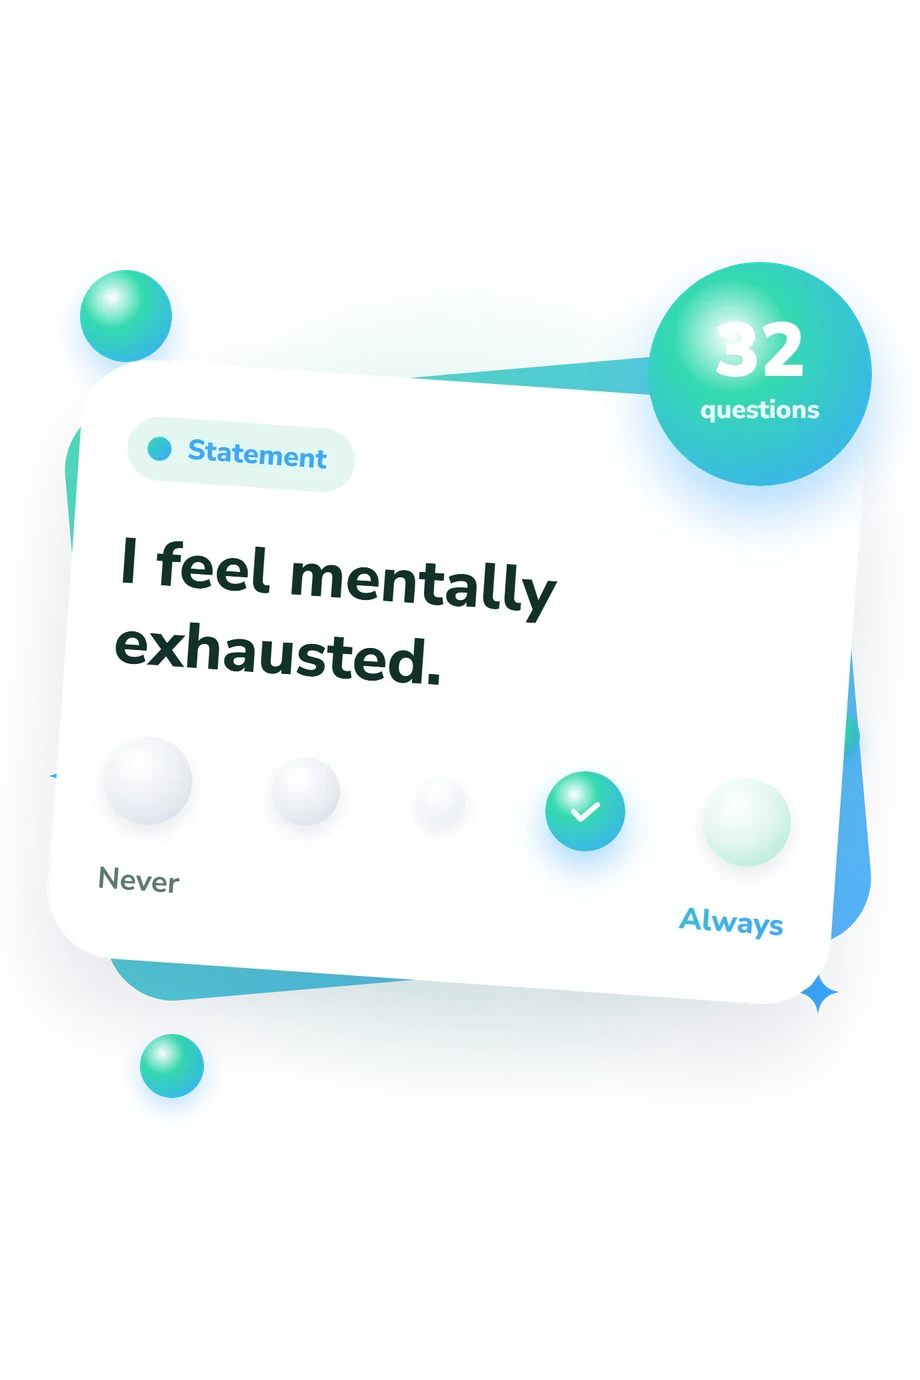
Example Questions From the Test
- Never
- Rarely
- Sometimes
- Often
- Always
- Never
- Rarely
- Sometimes
- Often
- Always
- Never
- Rarely
- Sometimes
- Often
- Always
Burnout Assessment Tool (BAT) Test - Description and methodology of the test
For people who feel worn down by sustained work demands, the Burnout Assessment Tool (BAT) Test offers a structured way to examine how strain is affecting energy, thinking, emotions, and the body. This burnout symptom assessment is intended for people reflecting on current work experiences and can show which areas appear more prominent, helping them decide what deserves closer attention in daily life or a broader professional conversation.
What This Assessment Explores
People using this work burnout test can see whether strain is most evident in energy, detachment, thinking, emotions, psychological symptoms, or physical symptoms. The profile separates these areas and shows where current difficulties appear more pronounced. The displayed scales are:
- Mental Distance (4-20) measures detachment, lost interest, and cynicism: Low 4-8; Moderate 9-14; High 15-20.
- Cognitive Impairment (5-25) measures attention, concentration, memory, and clear thinking: Low 5-11; Moderate 12-18; High 19-25.
- Emotional Difficulties (5-25) measures emotion-regulation difficulties, irritability, and reactivity: Low 5-11; Moderate 12-18; High 19-25.
- Psychological Complaints (5-25) measures sleep problems, worry, tension, anxiety, and panic: Low 5-11; Moderate 12-18; High 19-25.
- Psychosomatic Complaints (5-25) measures stress-attributed physical symptoms, including pain, digestive problems, headaches, and palpitations: Low 5-11; Moderate 12-18; High 19-25.
- Exhaustion (8-40) measures physical and mental fatigue: Low 8-18; Moderate 19-29; High 30-40.
Methodology and Scientific Basis
The BAT self-assessment uses first-person statements about work-related experiences and symptoms. Respondents choose an ordered frequency option, generally Never, Rarely, Sometimes, Often, or Always; some items use Constantly at the highest frequency. The tool displays a score range and result band for each domain, but the exact rule converting responses into points is not specified.
Published BAT development and Rasch studies provide measurement evidence for the instrument, while a European study provides severe-burnout cutoff evidence. This questionnaire is conceptually consistent with that published BAT work, but the online 32-question version is not documented as a reproduction or adaptation of the validated instrument. Separate norms or standardization for this questionnaire are not documented; the displayed result bands are this tool’s categories.
Interpretation works best as a pattern across domains. Workload, sleep, physical health, mood, self-awareness, and response style can affect answers, so the profile is a snapshot rather than a complete account of functioning. It does not establish a clinical diagnosis; interpretation should combine the profile with broader personal and occupational information.
- Schaufeli, W. B., Desart, S., & De Witte, H. (2020). Burnout Assessment Tool (BAT)-Development, Validity, and Reliability. International Journal of Environmental Research and Public Health, 17(24), 9495. 10.3390/ijerph17249495
- Schaufeli, W. B., De Witte, H., & Desart, S. (2020). Manual Burnout Assessment Tool (BAT)-Version 2.0. KU Leuven, Belgium: Unpublished internal report.
- Hadžibajramović, E., Schaufeli, W., & De Witte, H. (2020). A Rasch analysis of the Burnout Assessment Tool (BAT). PLOS ONE, 15(11), e0242241. 10.1371/journal.pone.0242241
- Schaufeli, W. B., De Witte, H., Hakanen, J. J., Kaltiainen, J., & Kok, R. (2023). How to assess severe burnout? Cutoff points for the Burnout Assessment Tool (BAT) based on three European samples. Scandinavian Journal of Work, Environment & Health, 49(4), 293-302. 10.5271/sjweh.4093
Updated: