
Freudly+971 508685814hello@freudly.ai
Freudly
security

Psychological Safety Threats Questionnaire Test
Take the online Psychological Safety Threats Questionnaire Test - AI psychologist FreudlyYou can take Psychological Safety Threats Questionnaire Testhere. Online version of a simple and accurate psychological test with interpretation.en
Understand which everyday threats drive your anxiety and sense of safety in about 7 minutes. Get a clear, actionable profile across key risk areas to guide support and reduce stress.
Start Online Test
Questions: 367 minutes
08:30
October 2, 2025
October 2, 2025
Material has been updated
October 2, 2025
Material has been published
21,117 views
1,863 completions
1,630 likes
Verified by Daniel Hall
Psychologist with 25 years of experience
Share
Scale Explorer

How the Scales are Structured

example score
9/18
Information Threats (IT)
Measures perceived psychological safety threats from exposure to and overload of negative or alarming information.
Low
Moderate
High
05: Low | 612: Moderate | 1318: High
A score of 9 falls in the Moderate range, suggesting a noticeable but not extreme impact of negative information exposure on perceived safety.
example score
2/18
Economic Threats (ET)
Measures perceived economic insecurity, such as worries about financial instability, loss of work or study, and limited control over material circumstances.
Low
Moderate
High
05: Low | 612: Moderate | 1318: High
A score of 2 falls in the Low range, indicating minimal concern about economic instability or loss of financial control at this time.
example score
12/18
Social Threats (ST)
Measures perceived threat from social factors such as relationship strain, isolation, loss of loved ones, and violence.
Low
Moderate
High
06: Low | 712: Moderate | 1318: High
A score of 12 indicates a moderate level of perceived social threats, suggesting these concerns are present and can meaningfully affect comfort and sense of safety.
example score
7/18
Military Threats (MT)
Measures perceived danger and anxiety related to war, terrorism, combat exposure, and forced displacement.
Low
Moderate
High
06: Low | 712: Moderate | 1318: High
A score of 7 indicates a moderate level of perceived military-related threats, suggesting these concerns are present but not dominant.
example score
9/18
Anthropogenic Threats (AT)
Measures how strongly a person perceives human-driven threats, including military, social, economic, and informational risks.
Low
Moderate
High
05: Low | 612: Moderate | 1318: High
A score of 9 indicates a moderate level of concern about anthropogenic threats, suggesting these risks are noticeable but not dominant.
example score
6/18
Health Threats (HT)
Assesses how strongly a person perceives threats related to mental and physical health deterioration, including illness, stress, fatigue, and sleep problems.
Low concern
Moderate concern
High concern
05: Low concern | 612: Moderate concern | 1318: High concern
A score of 6 indicates a moderate level of perceived health-related threats, suggesting these concerns are present but not dominant.
example score
12/18
Natural Threats (NT)
Measures perceived intensity of threat from natural hazards such as earthquakes, floods, storms, wildfires, and other disasters.
Low concern
Moderate concern
High concern
05: Low concern | 612: Moderate concern | 1318: High concern
A score of 12 indicates a moderate level of concern about natural threats, suggesting these risks are noticeable but not at the highest perceived intensity.
example score
41/108
Overall Threat Index (OTI)
Measures the cumulative intensity of perceived psychological safety threats across multiple life domains.
Low
Moderate
High
035: Low | 3672: Moderate | 73108: High
A score of 41 falls in the Moderate range, indicating a noticeable but not pervasive level of perceived threats overall.
Start Online Test
just completed the test
DATA-BASED USER COHORTS

Who Usually Takes This Test?

Anxious about current events
41%OF USERS
People who feel on edge from news, instability, or conflict use it to pinpoint which threats drive their anxiety most.
Clients in counseling
34%OF USERS
Individuals working with a psychologist or counselor take it to clarify their main stress triggers and guide a support plan.
High-stress professionals
25%OF USERS
Healthcare, education, security, and public-service workers use it to track perceived risks and prevent burnout during demanding periods.
BASED ON AGGREGATED, ANONYMIZED DATA FROM TENS OF THOUSANDS OF FREUDLY USERS.
Benchmarking

See How You Compare

Once you complete the test, your results are compared with real-world data from people in your country.
Below is a preview of how scores are typically distributed across each scale.
Information Threats (IT)
Average
13
Normal range
9.616.4
min.
0
max.
18
This curve shows how scores are typically distributed.
Once you complete the test, your result will appear on the scale so you can see how you compare.
Economic Threats (ET)
Average
6.3
Normal range
3.39.2
min.
0
max.
18
This curve shows how scores are typically distributed.
Once you complete the test, your result will appear on the scale so you can see how you compare.
Social Threats (ST)
Social Threats (ST)
Average
8
Normal range
5.111
min.
0
max.
18
This curve shows how scores are typically distributed.
Once you complete the test, your result will appear on the scale so you can see how you compare.
Military Threats (MT)
Average
7.9
Normal range
5.210.6
min.
0
max.
18
This curve shows how scores are typically distributed.
Once you complete the test, your result will appear on the scale so you can see how you compare.
Anthropogenic Threats (AT)
Average
4.7
Normal range
1.67.9
min.
0
max.
18
This curve shows how scores are typically distributed.
Once you complete the test, your result will appear on the scale so you can see how you compare.
Health Threats (HT)
Health Threats (HT)
Average
7.9
Normal range
5.410.3
min.
0
max.
18
This curve shows how scores are typically distributed.
Once you complete the test, your result will appear on the scale so you can see how you compare.
Natural Threats (NT)
Average
8.3
Normal range
5.611.1
min.
0
max.
18
This curve shows how scores are typically distributed.
Once you complete the test, your result will appear on the scale so you can see how you compare.
Overall Threat Level (OTL)
Average
54.1
Normal range
39.968.4
min.
0
max.
108
This curve shows how scores are typically distributed.
Once you complete the test, your result will appear on the scale so you can see how you compare.
Featured On
SAMPLE QUESTIONS

Example Questions From the Test

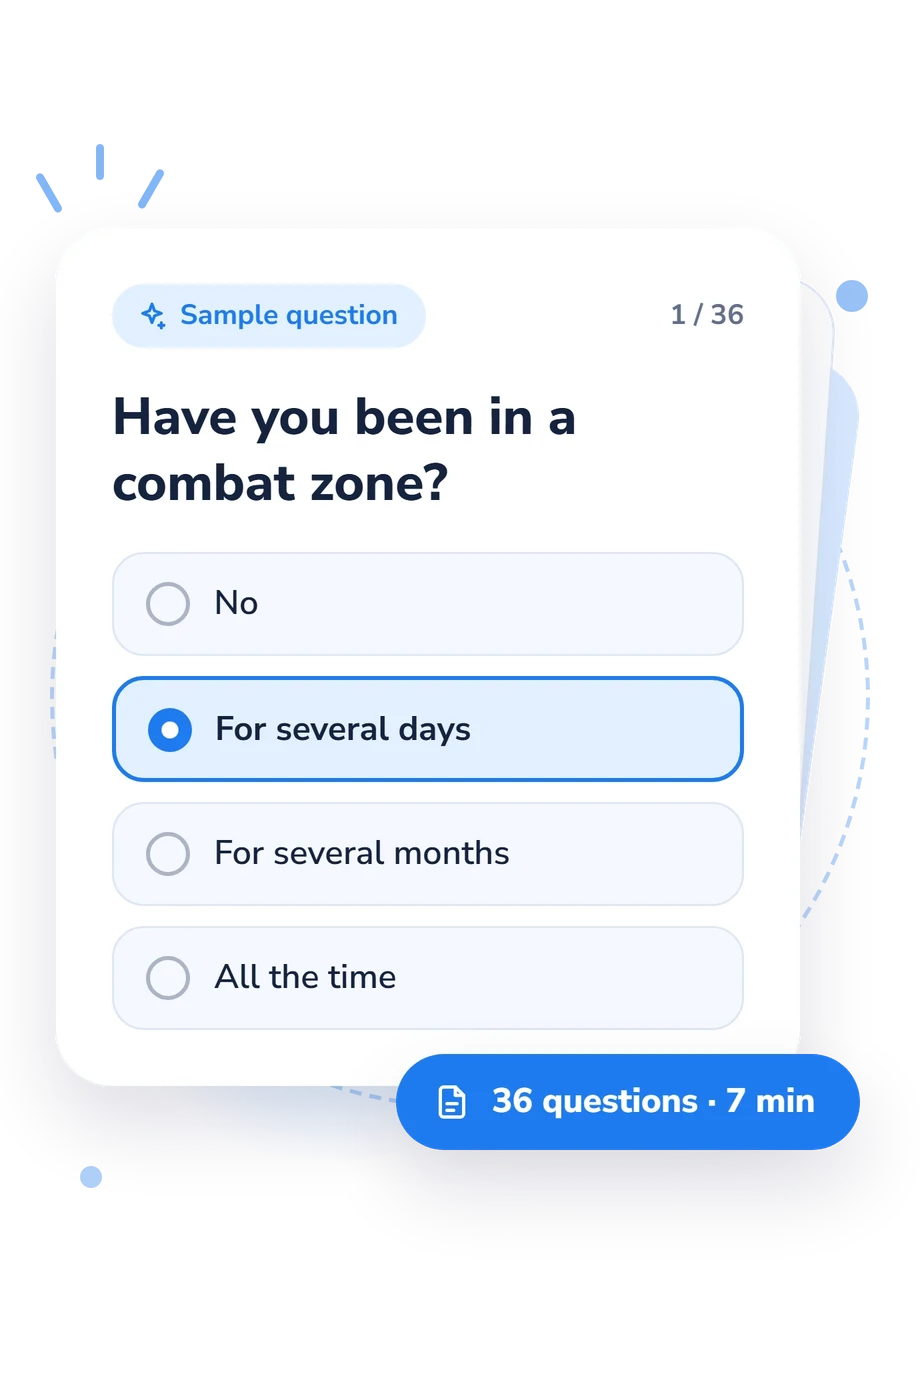
Please answer the questions by selecting one of the response options provided. Your responses should reflect the past year of your life.
    • No
    • For several days
    • For several months
    • All the time
    • No
    • For several days
    • For several months
    • All the time
    • No
    • For several days
    • For several months
    • All the time
WHAT THE TEST MEASURES
About This Assessment
Psychological Safety Threats Questionnaire Test

Psychological Safety Threats Questionnaire Test - Symptoms and Signs

security

This questionnaire is a self-report measure designed to assess perceived threats to an individual’s sense of psychological safety. The Psychological Safety Threats Questionnaire asks respondents to rate the extent to which different types of stressors or risks feel salient in their current life.

The measure includes 36 items and typically takes about 7 minutes to complete. It is intended to support clinical screening and needs assessment by clarifying which domains of perceived threat may be most prominent, which can inform case formulation and treatment planning.

The Psychological Safety Threats Questionnaire has been attributed to Amy C. Edmondson. Interpretation should be integrated with clinical interview data and other relevant measures, with attention to contextual factors that may shape perceived threat and distress.

Author: Amy C. Edmondson
Literature: Edmondson, A. C. Psychological safety and learning behavior in work teams. Administrative Science Quarterly. 1999.
Popular tests
Comments
Leave a Comment