
Freudly+971 508685814hello@freudly.ai
Freudly
arrange

Work Motivation Structure Assessment Test
Take the online Work Motivation Structure Assessment Test - AI psychologist FreudlyYou can take Work Motivation Structure Assessment Testhere. Online version of a simple and accurate psychological test with interpretation.en
Understand what drives you at work in just 3 minutes. Get clear, practical insights to boost satisfaction, engagement, and retention with 13 quick questions.
Start Online Test
Questions: 133 minutes
08:30
October 2, 2025
October 2, 2025
Material has been updated
October 2, 2025
Material has been published
28,605 views
1,756 completions
1,459 likes
Verified by Daniel Hall
Psychologist with 25 years of experience
Share
Scale Explorer

How the Scales are Structured

example score
0/3
Need for Personal Fulfillment (NfPF)
Measures the degree to which a person seeks self-expression and personal goal fulfillment through their work.
Low
Moderate
High
-3-1: Low | 0: Moderate | 13: High
A score of 0 suggests a balanced, situational need for self-actualization at work without a strong pull toward or away from self-fulfillment motives.
example score
1/3
Overall Job Satisfaction (OJS)
This scale measures overall satisfaction with work as a whole across its key aspects.
Low satisfaction
Mixed/neutral satisfaction
High satisfaction
-3-1: Low satisfaction | 0: Mixed/neutral satisfaction | 13: High satisfaction
A score of 1 indicates generally positive overall satisfaction with the job, with more satisfying than dissatisfying aspects.
example score
1/3
Opportunity for Creativity (OfC)
This scale measures satisfaction with opportunities to take initiative and express creativity at work.
Limited creativity
Creativity supported
-30: Limited creativity | 13: Creativity supported
A score of 1 suggests you generally feel there are opportunities to be creative and show initiative in your work.
example score
-1/3
Need for Social Interaction (NfSI)
Measures how important frequent interpersonal contact and workplace communication are to a person.
Lower need for communication
Moderate need for communication
Higher need for communication
-3-1: Lower need for communication | 0: Moderate need for communication | 13: Higher need for communication
A score of -1 suggests a lower-than-average need for workplace communication, with a tendency to feel comfortable with fewer social interactions at work.
example score
1/3
Relationships With Colleagues (RWC)
This scale measures how satisfied a person is with the team atmosphere and their interactions with coworkers.
Strained
Positive
-30: Strained | 13: Positive
A score of 1 suggests generally positive relationships with colleagues and a comfortable team atmosphere.
example score
0/3
Attitudes Toward Management (ATM)
Measures how fair, supportive, and respectful a person perceives the administration’s attitude toward them to be.
Negative
Neutral
Positive
-3-1: Negative | 0: Neutral | 13: Positive
A score of 0 suggests a neutral view of the administration, with neither clearly positive nor clearly negative perceptions of fairness, support, and respect.
example score
-1/3
Opportunities for Professional Development (OfPD)
Measures satisfaction with available opportunities for career growth, skill development, and learning at work.
Limited opportunities
Some opportunities
Strong opportunities
-3-1: Limited opportunities | 0: Some opportunities | 13: Strong opportunities
A score of -1 suggests you perceive professional development opportunities as limited, indicating lower satisfaction with growth and learning prospects in your current work context.
example score
1/3
Salary Level (SL)
This scale measures satisfaction with the amount of salary and other material compensation received for work.
Low satisfaction
Mixed/neutral
High satisfaction
-3-1: Low satisfaction | 0: Mixed/neutral | 13: High satisfaction
A score of 1 indicates generally adequate satisfaction with material compensation, suggesting pay is perceived as acceptable overall.
example score
-1/3
Sanitary and Hygienic Working Conditions (SaHWC)
Measures satisfaction with the workplace’s physical conditions such as lighting, temperature, cleanliness, and overall comfort.
Unsatisfactory
Adequate
Comfortable
-3-0.01: Unsatisfactory | 02.99: Adequate | 3: Comfortable
A score of -1 suggests some dissatisfaction with sanitary and hygienic aspects of the work environment, indicating conditions may feel less comfortable than desired.
example score
1/3
Work Organization (WO)
Assesses satisfaction with how work conditions and processes are organized and arranged.
Low satisfaction
Moderate satisfaction
High satisfaction
-3-1: Low satisfaction | 0: Moderate satisfaction | 13: High satisfaction
A score of 1 indicates generally positive satisfaction with the organization of work conditions and processes.
example score
0/3
Type of Work Activity (ToWA)
Measures satisfaction with and interest in the content and nature of the work tasks performed.
Low interest
Mixed/neutral interest
High interest
-3-1: Low interest | 0: Mixed/neutral interest | 13: High interest
A score of 0 suggests a mixed or neutral level of interest in the current work tasks, indicating neither clear dissatisfaction nor strong engagement with the job content.
example score
0/3
Occupational Prestige (OP)
Measures the importance a person places on their profession being socially respected and perceived as meaningful.
Low prestige focus
Balanced prestige focus
High prestige focus
-3-1: Low prestige focus | 0: Balanced prestige focus | 13: High prestige focus
A score of 0 suggests a balanced view where social prestige is neither a strong driver nor a strong deterrent in work motivation.
example score
1/3
Importance of the Profession (IotP)
Measures how personally important and valuable a person considers their chosen profession.
Low importance
Moderate importance
High importance
-3-1: Low importance | 0: Moderate importance | 13: High importance
A score of 1 indicates a high importance of the profession, suggesting a generally strong identification with and valuing of one’s professional activity.
example score
-2/39
Overall Job Satisfaction (OJS)
This scale measures how satisfied a person feels with their work overall.
Low satisfaction
High satisfaction
-39-1: Low satisfaction | 039: High satisfaction
A score of -2 falls in the low satisfaction range, suggesting slight overall dissatisfaction with work at the moment.
Start Online Test
just completed the test
DATA-BASED USER COHORTS

Who Usually Takes This Test?

HR and People Managers
41%OF USERS
They use it to quickly spot what drives employees and adjust rewards, feedback, and roles to improve engagement.
Employees Reassessing Careers
34%OF USERS
They take it to understand what they truly value at work and why motivation or satisfaction may be dropping.
Organizational Psychologists
25%OF USERS
They use it as a fast screening tool to identify dominant work motives and guide coaching or team interventions.
BASED ON AGGREGATED, ANONYMIZED DATA FROM TENS OF THOUSANDS OF FREUDLY USERS.
Benchmarking

See How You Compare

Once you complete the test, your results are compared with real-world data from people in your country.
Below is a preview of how scores are typically distributed across each scale.
Individual's need for self-actualization (Infs)
Average
-0.6
Normal range
-1.50.3
min.
-3
max.
3
This curve shows how scores are typically distributed.
Once you complete the test, your result will appear on the scale so you can see how you compare.
Satisfaction with the whole (Swtw)
Average
1
Normal range
-0.12.1
min.
-3
max.
3
This curve shows how scores are typically distributed.
Once you complete the test, your result will appear on the scale so you can see how you compare.
The Possibility of Creativity (TPoC)
Average
-1.4
Normal range
-2.2-0.6
min.
-3
max.
3
This curve shows how scores are typically distributed.
Once you complete the test, your result will appear on the scale so you can see how you compare.
The Need for Communication (TNfC)
Average
0.7
Normal range
-0.31.7
min.
-3
max.
3
This curve shows how scores are typically distributed.
Once you complete the test, your result will appear on the scale so you can see how you compare.
Relationships with Colleagues (RwC)
Average
-1.3
Normal range
-2.1-0.4
min.
-3
max.
3
This curve shows how scores are typically distributed.
Once you complete the test, your result will appear on the scale so you can see how you compare.
Attitude of the administration (Aota)
Average
1.2
Normal range
0.22.2
min.
-3
max.
3
This curve shows how scores are typically distributed.
Once you complete the test, your result will appear on the scale so you can see how you compare.
Possibility of professional development (Popd)
Average
0
Normal range
-0.80.8
min.
-3
max.
3
This curve shows how scores are typically distributed.
Once you complete the test, your result will appear on the scale so you can see how you compare.
Salary amount (Sa)
Salary amount (Sa)
Average
-0.6
Normal range
-1.60.3
min.
-3
max.
3
This curve shows how scores are typically distributed.
Once you complete the test, your result will appear on the scale so you can see how you compare.
Sanitary and Hygienic Conditions (SaHC)
Average
1.3
Normal range
0.32.3
min.
-3
max.
3
This curve shows how scores are typically distributed.
Once you complete the test, your result will appear on the scale so you can see how you compare.
Labor Organization (LO)
Average
0
Normal range
-0.80.8
min.
-3
max.
3
This curve shows how scores are typically distributed.
Once you complete the test, your result will appear on the scale so you can see how you compare.
Type of Employment (ToE)
Average
0
Normal range
-11
min.
-3
max.
3
This curve shows how scores are typically distributed.
Once you complete the test, your result will appear on the scale so you can see how you compare.
Prestige of the Profession (PotP)
Average
0.8
Normal range
-0.31.9
min.
-3
max.
3
This curve shows how scores are typically distributed.
Once you complete the test, your result will appear on the scale so you can see how you compare.
The Importance of the Profession (TIotP)
Average
1.4
Normal range
0.42.4
min.
-3
max.
3
This curve shows how scores are typically distributed.
Once you complete the test, your result will appear on the scale so you can see how you compare.
Overall job satisfaction (Ojs)
Average
-15.4
Normal range
-27.1-3.7
min.
-39
max.
39
This curve shows how scores are typically distributed.
Once you complete the test, your result will appear on the scale so you can see how you compare.
Featured On
SAMPLE QUESTIONS

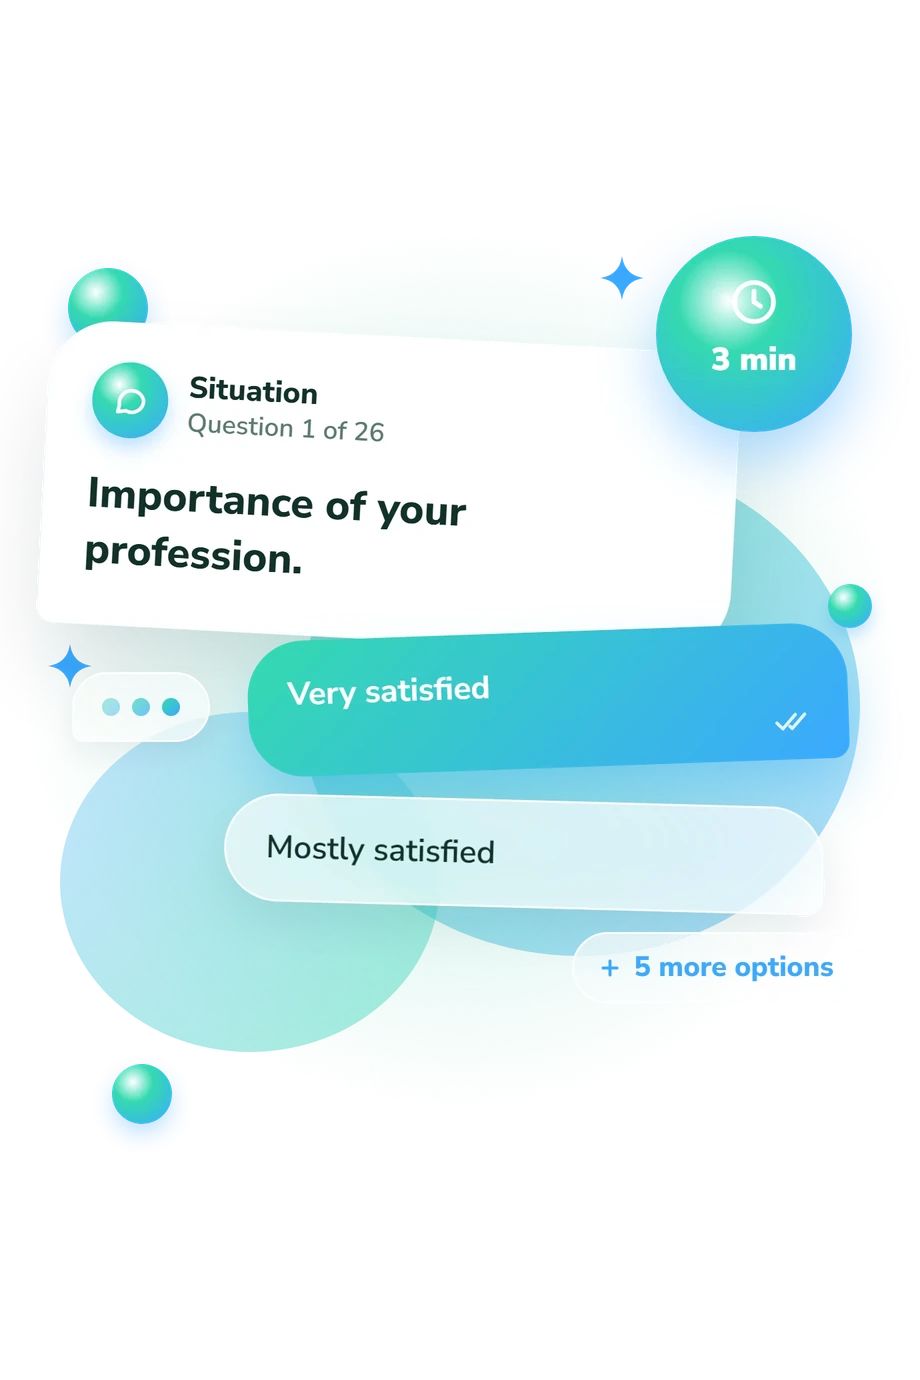
Example Questions From the Test

    • Very satisfied
    • Mostly satisfied
    • Somewhat satisfied
    • Neither satisfied nor dissatisfied
    • Somewhat dissatisfied
    • Mostly dissatisfied
    • Completely dissatisfied
    • Very satisfied
    • Mostly satisfied
    • Rather satisfied
    • Neither satisfied nor dissatisfied
    • Rather dissatisfied
    • Mostly dissatisfied
    • Completely dissatisfied
    • Very satisfied
    • Mostly satisfied
    • Rather satisfied
    • Neither satisfied nor dissatisfied
    • Rather dissatisfied
    • Mostly dissatisfied
    • Completely dissatisfied
WHAT THE TEST MEASURES
About This Assessment
Diagnosis of the Structure of Work Activity Motives Test

Work Motivation Structure Assessment Test - Symptoms and Signs

arrange
work motivation
job satisfaction

Work motivation can be assessed by examining the relative importance an individual assigns to common job-related incentives and satisfiers. The Work Motivation Structure Assessment is a brief self-report measure designed to identify the predominant themes that may influence an employee’s engagement and satisfaction at work.

It consists of 13 items and typically takes about 3 minutes to complete. Responses are used to generate a profile of motivational priorities that can inform workplace consultation, coaching, or organizational decision-making when interpreted in context. The Work Motivation Structure Assessment is attributed to Victor H. Vroom.

Author: Victor H. Vroom
Literature: Kanfer, R. Work motivation: Past, present, and future. In S. W. J. Kozlowski (Ed.), The Oxford handbook of organizational psychology. Oxford University Press. 2012.
Popular tests
Comments
Leave a Comment