
Student Learning Motivation Questionnaire Test
How the Scales are Structured
Who Usually Takes This Test?
See How You Compare
Below is a preview of how scores are typically distributed across each scale.
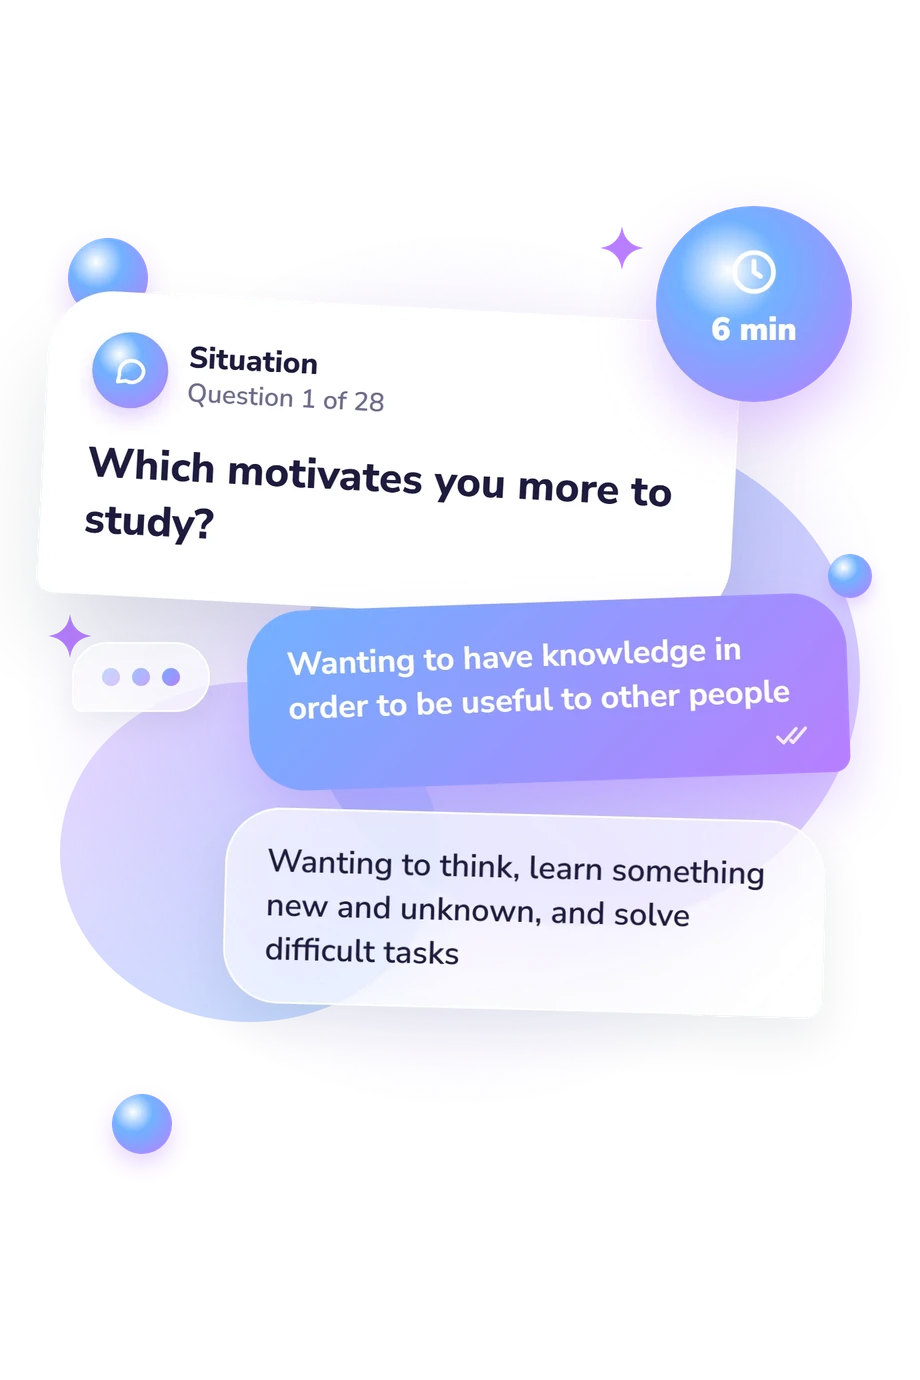
Example Questions From the Test
- Wanting to gain knowledge in order to be helpful to others
- Wanting to be among the best students
- Being among the best students.
- Becoming a well-educated, knowledgeable person.
- The desire to be among the top students
- The desire to do any task as well as possible
Student Learning Motivation Questionnaire Test - Description and methodology of the test
Students who want to understand what sustains their academic effort can use this questionnaire as a structured starting point. The Student Learning Motivation Questionnaire Test compares motives such as curiosity, achievement, approval, duty, pressure, and practical benefit, producing a profile rather than a single judgment. An academic motivation assessment can support reflection for learners, parents, and educators discussing study habits and learning conditions.
What This Assessment Explores
Contrasts include learning for discovery, using knowledge for personal significance, doing work carefully, securing future benefits, gaining recognition, meeting duties and others’ expectations, avoiding criticism, and avoiding punishment. This structure treats motivation as competing priorities rather than one level.
For an individual, the student motivation profile shows which reasons are prominent in study situations. Cognitive motivation concerns learning and discovery; the information-acquisition motive concerns the self-affirming personal significance of knowledge. Socially oriented motivation reflects duty, responsibility, and external expectations, alongside achievement, practical goals, prestige, conformity, or pressure. A high result on one motive does not imply a weakness.
The questionnaire is suitable for students and adults helping them discuss engagement, goals, feedback, and study conditions. Results can clarify why a task feels appealing or burdensome and support discussion of study goals, pressures, and conditions.
Methodology and Scientific Basis
Forced-choice items pair motives, and responses produce eight dimensions:
- Socially Dependent Behavior (Z), 0-7, measures conformity: Low conformity 0-2; Moderate conformity 3-5; High conformity 6-7.
- Achievement Motivation (Female), 0-7, measures success: Low 0-2; Moderate 3-5; High 6-7.
- Information Acquisition (E), 0-7, measures the personal significance of knowledge: Low 0-2; Moderate 3-5; High 6-7.
- Material Well-Being (D), 0-7, measures practical benefit: Low 0-2; Moderate 3-5; High 6-7.
- Prestige (G), 0-7, measures recognition: Low prestige focus 0-2; Moderate prestige focus 3-5; High prestige focus 6-7.
- Cognitive (B), 0-7, measures discovery: Low 0-2; Moderate 3-5; High 6-7.
- Socially Oriented (B), 0-7, measures duty and approval: Low 0-2; Moderate 3-5; High 6-7. External Coercion (A), 0-7, measures pressure: Low external pressure 0-2; Moderate external pressure 3-5; High external pressure 6-7.
Deci and Ryan’s self-determination framework and Pashnev’s student cognitive-activity work offer conceptual comparisons; this learning motivation questionnaire is conceptually consistent with them, not an adaptation or validated version. Displayed bands are descriptive categories; current context and response bias can affect self-report.
- Pashnev, B. K. (1995). Study of Students' Cognitive Activity at School. Kharkiv: Scientific-Methodological Pedagogical Center.
- Pashnev, B. K. (2010). Psychodiagnostics: A School Psychologist's Practical Manual: Giftedness Index, Inclination to Creativity, Cognitive Activity. Rostov-on-Don: Phoenix. ISBN 978-5-222-17017-5.
- Pashnev, B. K. (2005-2006). Psychodiagnostics of Giftedness. Practical Psychology and Social Work, 12, 59-65; 1, 24-30.
- Petrenko, Larisa M., Iryna P. Varava, and Andrey V. Pikilnyak. (2020). Motivation readiness of future software engineer’s professional self-improvement and prospects of its formation in college cloud environment. CTE Workshop Proceedings, 7, 626-647. 10.55056/cte.417
Updated: