
Freudly+971 508685814hello@freudly.ai
Freudly
attitude towards illness

Secondary Gain From Illness Scale Test
Take the online Secondary Gain From Illness Scale Test - AI psychologist FreudlyYou can take Secondary Gain From Illness Scale Test here. Online version of a simple and accurate psychological test with interpretation.en
In about 8 minutes, see how hidden benefits of being unwell may affect recovery. Get clear insight to target blocks, build motivation, and guide focused therapy goals.
Start Online Test
Questions: 408 minutes
08:30
October 2, 2025
October 2, 2025
Material has been updated
October 2, 2025
Material has been published
14,477 views
1,752 completions
1,503 likes
Verified by Daniel Hall
Psychologist with 25 years of experience
Share
Scale Explorer

How the Scales are Structured

example score
3/5
Autonomy (A)
Measures the degree of independence, self-management, and ability to regulate one’s own activities.
Low autonomy
Moderate autonomy
High autonomy
12.3: Low autonomy | 2.43.6: Moderate autonomy | 3.75: High autonomy
A score of 3 indicates a moderate level of autonomy, suggesting a mixed pattern of self-directed regulation with some reliance on external structure or support.
example score
2/5
Recovery Pathways (RP)
Measures the extent to which a person relies on constructive, recovery-supporting strategies to reduce symptoms and promote improvement.
Limited strategies
Developing strategies
Strong strategies
12.3: Limited strategies | 2.43.6: Developing strategies | 3.75: Strong strategies
A score of 2 indicates relatively limited use of constructive recovery strategies, suggesting fewer identifiable resources currently being mobilized to support improvement.
example score
3/5
Cost of Recovery (CoR)
Measures how much perceived loss or sacrifice in relationships and habitual behaviors is associated with pursuing recovery.
Low perceived cost
Moderate perceived cost
High perceived cost
12.3: Low perceived cost | 2.43.6: Moderate perceived cost | 3.75: High perceived cost
A score of 3 indicates a moderate perceived cost of recovery, suggesting you anticipate some meaningful but manageable losses or changes in relationships and behaviors if you get better.
example score
3/5
Recovery Resources (RR)
Measures the emotional and cognitive resources that can be mobilized to support recovery or health improvement.
Limited resources
Moderate resources
Strong resources
12.3: Limited resources | 2.43.6: Moderate resources | 3.75: Strong resources
A score of 3 indicates a moderate level of recovery resources, suggesting some supportive potential is present but may be inconsistent or context-dependent.
example score
3/5
Malingering (M)
Measures the tendency to present oneself as ill to obtain sympathy, support, or reduced obligations.
Low
Moderate
High
12: Low | 3: Moderate | 45: High
A score of 3 suggests a moderate likelihood of occasionally emphasizing illness-related difficulties in ways that may bring interpersonal or practical benefits.
example score
2/5
Conformity (C)
Measures how strongly a person’s views about their illness are shaped by others’ opinions and expectations.
Low conformity
Moderate conformity
High conformity
12.3: Low conformity | 2.43.6: Moderate conformity | 3.75: High conformity
A score of 2 suggests relatively low dependence on others’ opinions, so social expectations are less likely to steer your attitude toward illness.
example score
2/5
Somatization Triggers (ST)
Measures how strongly emotional states are reflected in physical sensations, indicating a tendency toward somatization.
Low
Moderate
High
12.3: Low | 2.43.6: Moderate | 3.75: High
A score of 2 falls in the Low range, suggesting emotional strain is less likely to be expressed through physical symptoms in day-to-day experience.
example score
3/5
Regression (R)
Measures the extent to which a person copes with stress by reverting to earlier, less mature behavior patterns.
Low regression
Moderate regression
High regression
12.3: Low regression | 2.43.6: Moderate regression | 3.75: High regression
A score of 3 indicates a moderate tendency to fall back on earlier coping patterns under strain, which may intermittently influence recovery-related behavior.
example score
3/5
Overall Level of Secondary Gain From Illness (OLoSGFI)
Measures the overall tendency to obtain psychological or practical benefits from being ill, which can indirectly maintain symptoms or slow recovery efforts.
Low
Moderate
High
12.3: Low | 2.43.6: Moderate | 3.75: High
A score of 3 indicates a moderate level of secondary gain, suggesting some illness-related benefits may be present and could influence motivation for change at times.
Start Online Test
just completed the test
DATA-BASED USER COHORTS

Who Usually Takes This Test?

Chronic symptom seekers
41%OF USERS
People with long-running or recurring health complaints who want to understand whether hidden emotional payoffs are keeping symptoms going.
Therapy and counseling clients
34%OF USERS
People already in therapy or coaching who feel stuck in recovery and want clearer insight into the psychological blocks behind it.
Caregivers and helpers
25%OF USERS
Partners, relatives, or support workers trying to make sense of why a loved one may resist getting better and how to support change.
BASED ON AGGREGATED, ANONYMIZED DATA FROM TENS OF THOUSANDS OF FREUDLY USERS.
Benchmarking

See How You Compare

Once you complete the test, your results are compared with real-world data from people in your country.
Below is a preview of how scores are typically distributed across each scale.
Autonomy (A)
Autonomy (A)
Average
3
Normal range
2.53.5
min.
1
max.
5
This curve shows how scores are typically distributed.
Once you complete the test, your result will appear on the scale so you can see how you compare.
Ways to Recover (WtR)
Average
3.3
Normal range
2.74
min.
1
max.
5
This curve shows how scores are typically distributed.
Once you complete the test, your result will appear on the scale so you can see how you compare.
Recovery Cost (RC)
Recovery Cost (RC)
Average
2.1
Normal range
1.62.7
min.
1
max.
5
This curve shows how scores are typically distributed.
Once you complete the test, your result will appear on the scale so you can see how you compare.
Recovery Resources (RR)
Average
3.1
Normal range
2.63.6
min.
1
max.
5
This curve shows how scores are typically distributed.
Once you complete the test, your result will appear on the scale so you can see how you compare.
Simulation (S)
Simulation (S)
Average
2.3
Normal range
1.72.8
min.
1
max.
5
This curve shows how scores are typically distributed.
Once you complete the test, your result will appear on the scale so you can see how you compare.
Conformity (C)
Conformity (C)
Average
3.1
Normal range
2.63.6
min.
1
max.
5
This curve shows how scores are typically distributed.
Once you complete the test, your result will appear on the scale so you can see how you compare.
Triggers of Somatization (ToS)
Average
2.8
Normal range
2.33.3
min.
1
max.
5
This curve shows how scores are typically distributed.
Once you complete the test, your result will appear on the scale so you can see how you compare.
Regression (R)
Regression (R)
Average
2.5
Normal range
1.93.1
min.
1
max.
5
This curve shows how scores are typically distributed.
Once you complete the test, your result will appear on the scale so you can see how you compare.
Overall level of secondary gain from illness (Olosgfi)
Average
3.7
Normal range
3.14.2
min.
1
max.
5
This curve shows how scores are typically distributed.
Once you complete the test, your result will appear on the scale so you can see how you compare.
Featured On
SAMPLE QUESTIONS

Example Questions From the Test

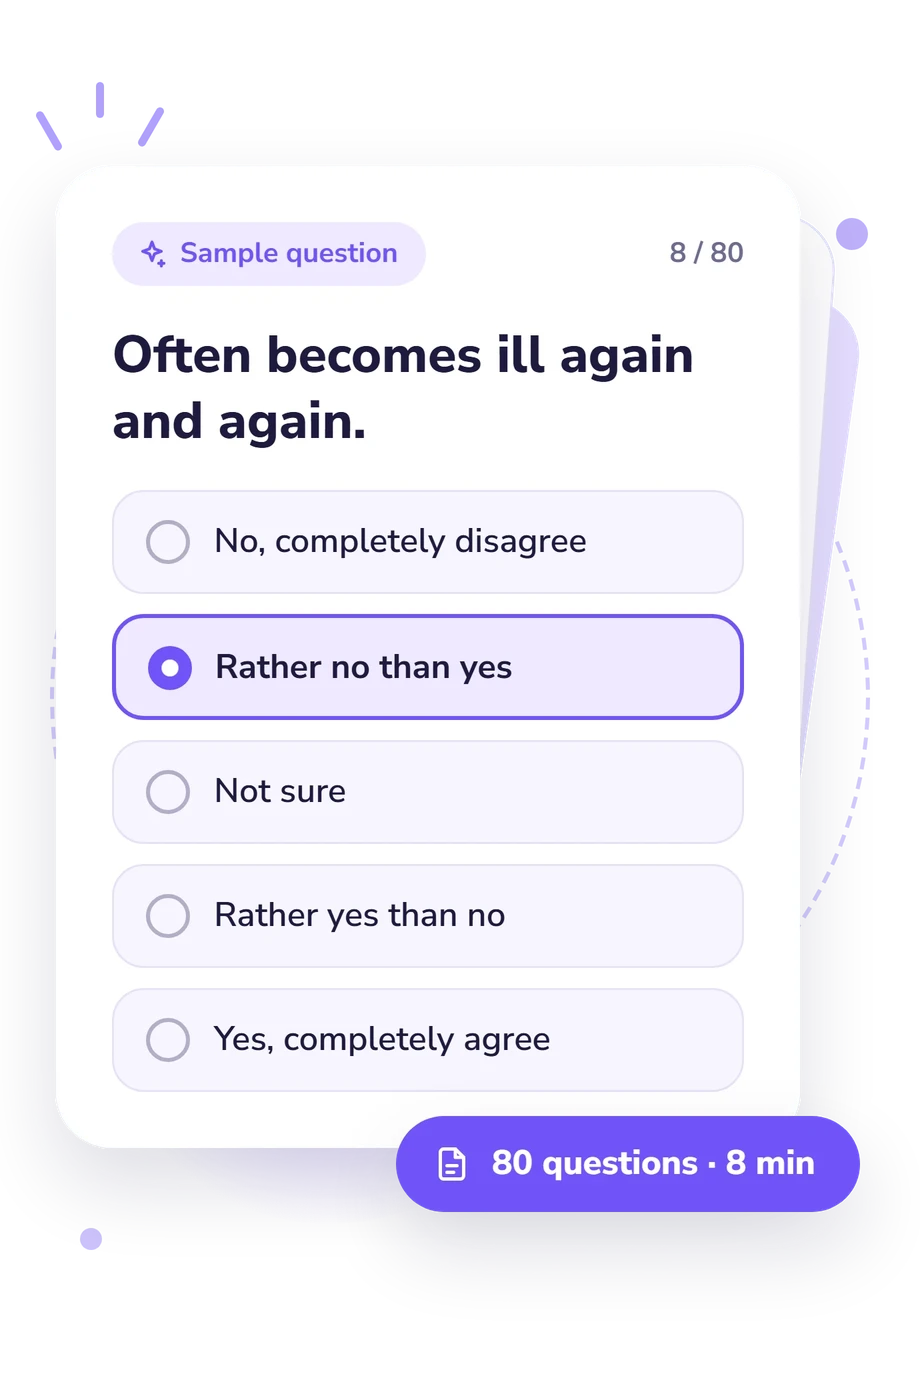
The questionnaire consists of two parts. The first part describes the period when a person is ill. The second part reflects the recovery process. Please recall your experience interacting with individuals who are ill for long periods or who become ill frequently and, based on that experience, indicate your opinion using the statements provided below.
    • No, completely disagree
    • More likely no than yes
    • Hard to say
    • More likely yes than no
    • Yes, completely agree
    • No, strongly disagree
    • Rather no than yes
    • Difficult to answer
    • Rather yes than no
    • Yes, strongly agree
    • No, completely disagree
    • Rather no than yes
    • Difficult to answer
    • Rather yes than no
    • Yes, completely agree
WHAT THE TEST MEASURES
About This Assessment
Secondary Gain from Illness Test

Secondary Gain From Illness Scale Test - Symptoms and Signs

attitude towards illness
benefit from illness

This self-report measure examines potential psychological and interpersonal reinforcements that may be associated with maintaining illness-related behaviors. The Secondary Gain From Illness Scale is intended to support clinical case formulation by identifying perceived benefits of illness (e.g., increased attention, relief from demands) that could influence motivation for change.

It consists of 40 items and typically takes about 8 minutes to complete. Results are best interpreted in context and used to guide collaborative discussion and treatment planning rather than as a standalone indicator of intent or malingering. The Secondary Gain From Illness Scale may be useful as part of a broader assessment when exploring barriers to recovery and factors that may sustain health-related difficulties.

Author: K. D. Williams
Literature: Kroenke, K. Patients presenting with somatic complaints: Epidemiology, psychiatric comorbidity and management. International Journal of Methods in Psychiatric Research. 2003.; Friedman, W. J. The benefits of suffering and the costs of well being: Secondary gains and losses. Journal of Psychosomatic Research. 2000.
Popular tests
Comments
Leave a Comment