
Communication Style Questionnaire Test
How the Scales are Structured
Who Usually Takes This Test?
See How You Compare
Below is a preview of how scores are typically distributed across each scale.
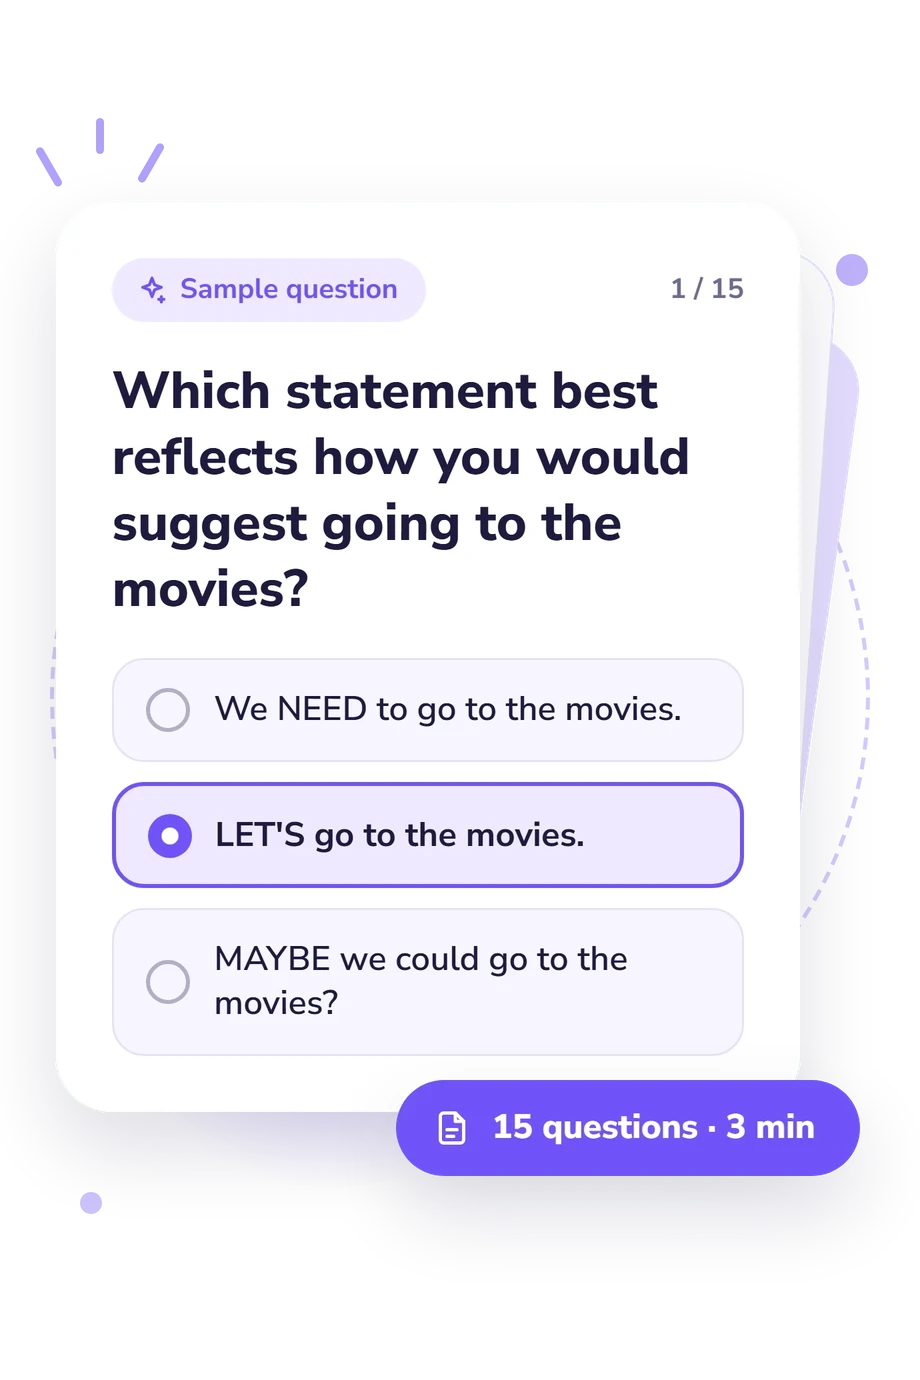
Example Questions From the Test
- We NEED to go to the movies.
- LET'S go to the movies.
- MAYBE we could go to the movies?
- I should get help.
- I will get help.
- I want to get help.
- We MUST eat.
- We CAN eat.
- MAYBE we should eat?
Communication Style Questionnaire Test - Description and methodology of the test
Readers who want to understand how they naturally express ideas can use this Communication Style Questionnaire Test as a brief self-reflection tool. It is intended for anyone curious about the language, sensory cues, and interpersonal stance they bring to everyday conversations. This communication style assessment highlights patterns to consider, rather than reducing a person to one fixed label.
What This Assessment Explores
Item wording contrasts sensory verbs, modal expressions, and interpersonal reactions. The profile describes how a person receives information and positions themselves in conversation. The communication questionnaire presents these dimensions:
- Kinesthetic (Sensory) Modality (0-6) reflects bodily experience: Low sensory focus 0-2; Balanced sensory focus 3-4; High sensory focus 5-6.
- Auditory (0-6) reflects sound-based information: Low auditory focus 0-2; Balanced auditory focus 3-4; High auditory focus 5-6.
- Visual (0-6) reflects visual imagery: Low visual focus 0-2; Moderate visual focus 3-4; High visual focus 5-6.
- Child (0-6) reflects impulsivity, pleasure seeking, and responsibility shifting: Low 0-2; Moderate 3-4; High 5-6.
- B: Adult (0-6) reflects rational, objective, fact-based regulation: Low adult state 0-2; Moderate adult state 3-4; High adult state 5-6.
- A: Parent (0-6) reflects right-wrong judgments and responsibility for others: Low Parent 0-2; Moderate Parent 3-4; High Parent 5-6.
Methodology and Evidence Base
Each item presents a short situation or sentence choice, so the respondent selects the wording that feels most natural rather than rating agreement. The set covers sensory references, action and obligation language, emotional reactions, and ways of acknowledging or maintaining contact. This communication style quiz uses a forced-choice format, so the result depends on relative response patterns across the available options.
Choices map to separate results, but the questionnaire does not state how each response contributes to a score. The displayed bands are the questionnaire’s score interpretations, and the unstated response-to-score rule means readers cannot reconstruct how individual answers affect a result.
The questionnaire’s practical format is conceptually consistent with Kincher’s Psychology for Kids; its sensory wording is also conceptually consistent with Bandler and Grinder’s representational-system approach, while its ego-state vocabulary aligns with Berne’s transactional analysis. These relationships identify interpretive parallels, not evidence that the online questionnaire reproduces those instruments or their validation. Self-report can reflect current context, self-awareness, and response bias, so the result is best read as a starting point for reflection rather than a clinical conclusion.
- Kincher, Jonni. Psychology for Kids: 40 Fun Tests That Help You Learn about Yourself. Free Spirit Publishing, 1995. ISBN 978-0-915793-85-3.
- Bandler, Richard, and John Grinder. The Structure of Magic II: A Book About Communication and Change. Science and Behavior Books, 1976. ISBN 978-0-8314-0049-1.
- Berne, Eric. Transactional Analysis in Psychotherapy: A Systematic Individual and Social Psychiatry. Grove Press, 1961.
- Berne, Eric. Transactional Analysis: A New and Effective Method of Group Therapy. American Journal of Psychotherapy, vol. 12, no. 4, 1958, pp. 735-743. 10.1176/appi.psychotherapy.1958.12.4.735
Updated: