
Freudly+971 508685814hello@freudly.ai
Freudly
personality type

Type Identifier Test
Take the online Type Identifier Test - AI psychologist FreudlyYou can take Type Identifier Testhere. Online version of a simple and accurate psychological test with interpretation.en
Get a quick 5-minute snapshot of your socionics type and core preferences. Fast results help you spot patterns, blind spots, and where deeper observation may be needed.
Start Online Test
Questions: 245 minutes
08:30
October 2, 2025
October 2, 2025
Material has been updated
October 2, 2025
Material has been published
18,175 views
1,970 completions
1,636 likes
Verified by Daniel Hall
Psychologist with 25 years of experience
Share
Scale Explorer

How the Scales are Structured

example score
3/6
Introversion (I)
Measures the degree to which you prefer inner reflection and a smaller social sphere over outward social engagement.
Low introversion
Moderate introversion
High introversion
02: Low introversion | 34: Moderate introversion | 56: High introversion
A score of 3 indicates a moderate introversion level, suggesting a balanced mix of reflection/solitude and comfort with social interaction.
example score
4/6
Extraversion (E)
This scale measures how strongly you orient toward the external world through social engagement, activity, and seeking new experiences.
Lower extraversion
Moderate extraversion
Higher extraversion
02: Lower extraversion | 34: Moderate extraversion | 56: Higher extraversion
A score of 4 suggests moderately expressed extraverted tendencies, with comfort in engaging outwardly while not needing constant stimulation or attention.
example score
2/6
Intuition (I)
This scale measures your tendency toward intuitive, abstract, future-oriented thinking and noticing hidden connections.
Lower intuition
Moderate intuition
Higher intuition
02: Lower intuition | 34: Moderate intuition | 56: Higher intuition
A score of 2 suggests a lower emphasis on intuition, with a preference for more concrete or present-focused information over exploring abstract possibilities.
example score
3/6
Sensing (S)
Measures preference for concrete sensory experience, practicality, and attention to tangible details versus intuitive abstraction.
More intuitive-leaning
Balanced
More sensory-leaning
02: More intuitive-leaning | 34: Balanced | 56: More sensory-leaning
A score of 3 falls in the Balanced range, suggesting a roughly even mix of attention to concrete details and openness to broader, more intuitive impressions.
example score
2/6
Ethics (E)
Measures orientation toward feelings, emotional cues, and interpersonal norms when evaluating situations and making decisions.
Low ethics focus
Moderate ethics focus
High ethics focus
02: Low ethics focus | 34: Moderate ethics focus | 56: High ethics focus
A score of 2 suggests a relatively low tendency to prioritize emotional dynamics and social-norm considerations compared with other decision cues.
example score
1/6
Logic (L)
This scale measures preference for objective, fact-based analysis and structured reasoning versus ethical, value-focused judgment.
Lower Logic
Mixed
Higher Logic
02: Lower Logic | 34: Mixed | 56: Higher Logic
A score of 1 falls in the Lower Logic range, suggesting you may rely less on formal analysis and structure and more on contextual or value-based cues when deciding.
example score
2/6
Irrationality (I)
This scale measures preference for flexibility and improvisation versus structured planning when organizing activities and making decisions.
More structured
Mixed style
More flexible
02: More structured | 34: Mixed style | 56: More flexible
A score of 2 falls in the “More structured” range, suggesting you tend to prefer clearer plans and frameworks over spontaneous adaptation in day-to-day choices.
example score
3/6
R (R)
This scale measures preference for structured, planned, and consistent action versus spontaneity.
More flexible
Balanced
More structured
02: More flexible | 34: Balanced | 56: More structured
A score of 3 suggests a balanced tendency to use planning and structure while still allowing room for situational flexibility.
Start Online Test
just completed the test
DATA-BASED USER COHORTS

Who Usually Takes This Test?

Socionics Curious Beginners
41%OF USERS
People new to socionics who want a quick first guess at their type before reading deeper or seeking feedback.
Type Theory Hobbyists
34%OF USERS
Fans of personality systems who compare different methods and take the questionnaire to see which preferences they consistently pick.
Typing Practitioners and Coaches
25%OF USERS
Professionals who use the test as a rough baseline and a teaching tool to show the limits of self-report typing.
BASED ON AGGREGATED, ANONYMIZED DATA FROM TENS OF THOUSANDS OF FREUDLY USERS.
Benchmarking

See How You Compare

Once you complete the test, your results are compared with real-world data from people in your country.
Below is a preview of how scores are typically distributed across each scale.
And (A)
And (A)
Average
3.3
Normal range
2.34.3
min.
0
max.
6
This curve shows how scores are typically distributed.
Once you complete the test, your result will appear on the scale so you can see how you compare.
E (E)
E (E)
Average
1.9
Normal range
1.12.7
min.
0
max.
6
This curve shows how scores are typically distributed.
Once you complete the test, your result will appear on the scale so you can see how you compare.
And (A)
And (A)
Average
3.5
Normal range
2.54.6
min.
0
max.
6
This curve shows how scores are typically distributed.
Once you complete the test, your result will appear on the scale so you can see how you compare.
C (C)
C (C)
Average
2.8
Normal range
1.93.7
min.
0
max.
6
This curve shows how scores are typically distributed.
Once you complete the test, your result will appear on the scale so you can see how you compare.
E (E)
E (E)
Average
3.7
Normal range
2.84.6
min.
0
max.
6
This curve shows how scores are typically distributed.
Once you complete the test, your result will appear on the scale so you can see how you compare.
L (L)
L (L)
Average
2.3
Normal range
1.23.4
min.
0
max.
6
This curve shows how scores are typically distributed.
Once you complete the test, your result will appear on the scale so you can see how you compare.
And (A)
And (A)
Average
2.6
Normal range
1.63.6
min.
0
max.
6
This curve shows how scores are typically distributed.
Once you complete the test, your result will appear on the scale so you can see how you compare.
R (R)
R (R)
Average
4.4
Normal range
3.45.4
min.
0
max.
6
This curve shows how scores are typically distributed.
Once you complete the test, your result will appear on the scale so you can see how you compare.
Featured On
SAMPLE QUESTIONS

Example Questions From the Test

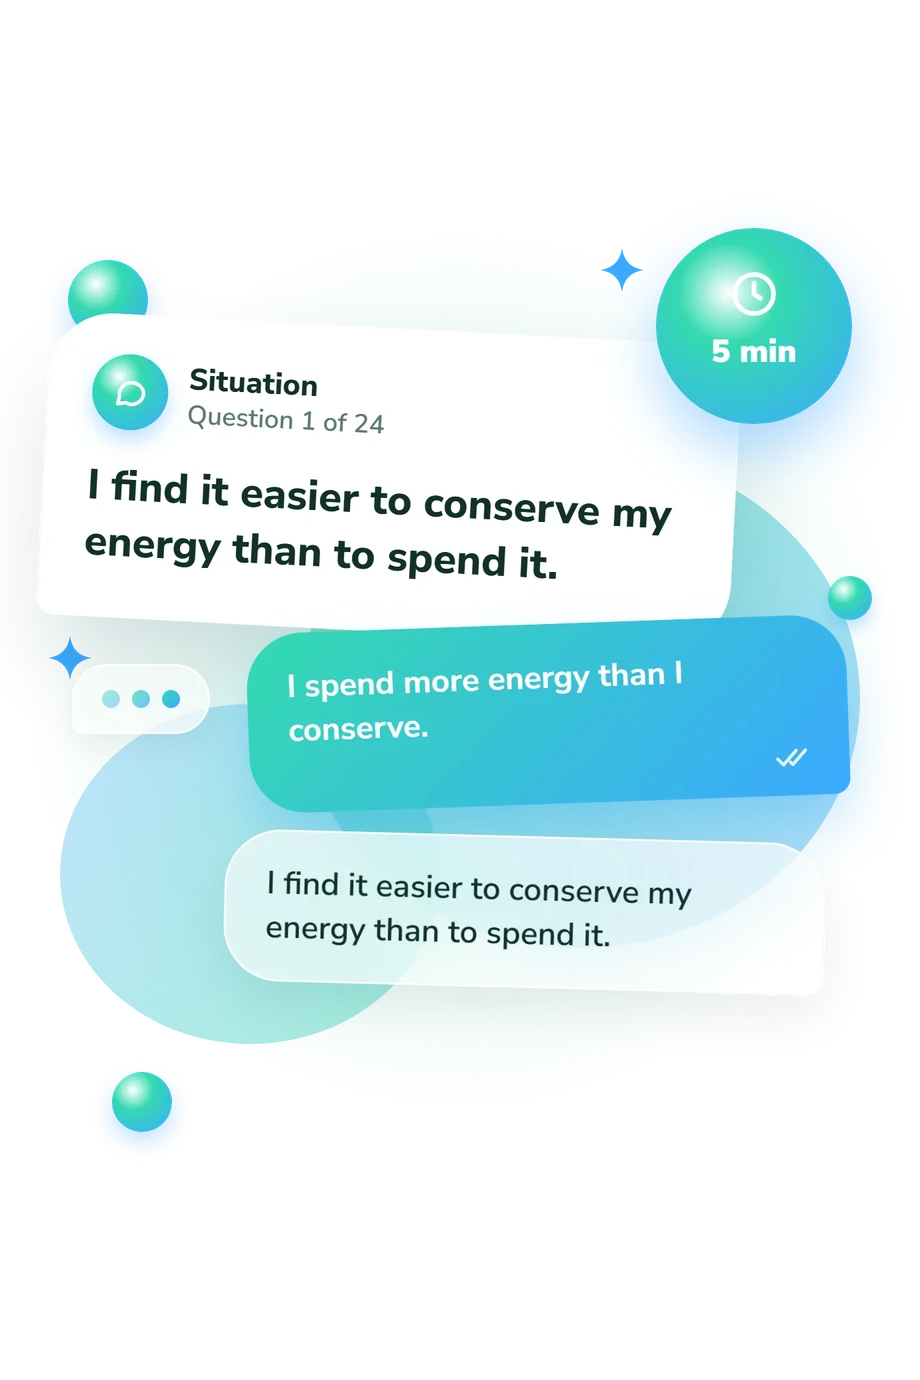
    • I spend more energy than I conserve.
    • I find it easier to conserve my energy than to spend it.
    • I am calm only when everything is well organized.
    • I cannot do without a constant change of experiences.
    • Emotions never affect me deeply.
    • I am a person of feelings and emotions.
WHAT THE TEST MEASURES
About This Assessment
Gulenko's Typology Identifier Test

Type Identifier Test - Symptoms and Signs

personality type

This self-report measure is intended to provide a brief snapshot of personality type preferences, based on forced-choice comparisons. The Type Identifier presents paired statements designed to elicit relative preferences that may be used to inform an initial typology hypothesis.

The instrument includes 24 items and typically requires about 5 minutes to complete. Results are best interpreted as provisional and should be integrated with additional clinical information (e.g., interview data, behavioral observations, and contextual factors), given the known limitations of brief questionnaire-based typing.

Although it is sometimes attributed to Isabel Briggs Myers and Katharine C. Briggs, the Type Identifier should be used as an exploratory aid rather than a standalone basis for classification or decision-making.

Author: Isabel Briggs Myers, Katharine C. Briggs
Literature: Jung, C. G. Psychological types. Princeton University Press. 1971.
Popular tests
Comments
Leave a Comment