
Freudly+971 508685814hello@freudly.ai
Freudly
cbt

Relationship Emotional Schemas Scale (RESS) Test
Take the online Relationship Emotional Schemas Scale (RESS) Test - AI psychologist FreudlyYou can take Relationship Emotional Schemas Scale (RESS) Testhere. Online version of a simple and accurate psychological test with interpretation.en
Understand how you perceive your partner responding to your difficult emotions in just 3 minutes. Get a clear snapshot of key patterns to guide healthier communication and therapy goals.
Start Online Test
Questions: 143 minutes
08:30
October 2, 2025
October 2, 2025
Material has been updated
October 2, 2025
Material has been published
19,399 views
1,945 completions
1,690 likes
Verified by Daniel Hall
Psychologist with 25 years of experience
Share
Scale Explorer

How the Scales are Structured

example score
3/6
Rumination (R)
Rumination measures how much a person tends to repeatedly revisit and dwell on negative emotions during relationship stress.
Low
Moderate
High
02: Low | 34: Moderate | 56: High
A score of 3 suggests a moderate tendency to dwell on unpleasant feelings, with some difficulty letting them go at times.
example score
2/6
Acceptance (A)
Acceptance measures how willing you are to allow and acknowledge your emotions without judging them.
Low acceptance
Moderate acceptance
High acceptance
02: Low acceptance | 34: Moderate acceptance | 56: High acceptance
A score of 2 suggests low acceptance, indicating you may often judge or struggle to make room for difficult emotions when relationship tension arises.
example score
2/6
Duration (D)
Duration measures how long emotional responses tend to persist within relationship situations.
Brief
Moderate
Prolonged
02: Brief | 34: Moderate | 56: Prolonged
A score of 2 suggests emotions in relationship contexts tend to pass relatively quickly rather than lingering for long periods.
example score
3/6
Blame (B)
Accusation measures the extent to which a person attributes responsibility for their emotional distress to their partner rather than to their own emotional experience.
Low
Moderate
High
02: Low | 34: Moderate | 56: High
A score of 3 suggests a moderate tendency to place some responsibility for difficult feelings on the partner, alongside some capacity to recognize personal ownership of emotions.
example score
3/6
Emotional Expression (EE)
Measures how openly a person expresses and shares their emotions within a relationship during difficult moments.
Reserved
Selective
Open
02: Reserved | 34: Selective | 56: Open
A score of 3 suggests a selective style of emotional expression, where feelings may be shared in some situations but held back in others.
example score
4/6
Consensus (C)
Consensus measures how strongly a person wants their emotional experience and expression to align with their partner’s.
Low consensus
Moderate consensus
High consensus
02: Low consensus | 34: Moderate consensus | 56: High consensus
A score of 4 suggests a moderate preference for emotional harmony, with noticeable but flexible expectations that a partner will match or validate your emotional tone.
example score
4/6
Rationality (R)
Rationality measures how strongly you rely on logical analysis and reflection when making sense of emotions in your relationship.
Low rationality
Balanced
High rationality
02: Low rationality | 34: Balanced | 56: High rationality
A score of 4 suggests a generally balanced approach, with a noticeable tendency to use reason to understand emotions when relationship tension arises.
example score
4/6
Emotional Numbness (EN)
Measures perceived emotional detachment or suppression of feelings in relationship situations, especially when distress is present.
Low numbness
Moderate numbness
High numbness
02: Low numbness | 34: Moderate numbness | 56: High numbness
A score of 4 falls in the Moderate numbness range, suggesting you may often feel somewhat emotionally shut down or find it harder to empathize and express feelings during relationship tension.
example score
2/6
Control (C)
Control measures how effectively you regulate and express your emotions during relationship tension.
Low control
Moderate control
High control
02: Low control | 34: Moderate control | 56: High control
A score of 2 suggests low emotional control in relationship stress, with emotions more likely to feel hard to manage or express steadily.
example score
2/6
Values (V)
Measures how strongly a person relies on their personal values to guide how they express and respond to emotions in the relationship.
Low values-guided
Moderate values-guided
High values-guided
02: Low values-guided | 34: Moderate values-guided | 56: High values-guided
A score of 2 suggests emotions in the relationship are less consistently guided by internal values and may be shaped more by the moment or the partner’s perceived reactions.
example score
3/6
Differentiation (D)
Differentiation measures how well you can distinguish your own emotions from your partner’s emotions during relationship stress.
Low differentiation
Moderate differentiation
High differentiation
02: Low differentiation | 34: Moderate differentiation | 56: High differentiation
A score of 3 suggests a moderate ability to keep your feelings separate from your partner’s, with some blending likely in more emotionally charged moments.
example score
3/6
Validation (V)
Validation measures how much a person experiences their emotions as accepted and acknowledged as meaningful in the relationship context.
Low validation
Moderate validation
High validation
02: Low validation | 34: Moderate validation | 56: High validation
A score of 3 suggests a moderate level of validation, with some ability to recognize feelings as meaningful but also a tendency to downplay them at times.
example score
4/6
Emotional Clarity (EC)
Clarity measures how clearly a person can identify and differentiate their own emotions within relationship situations.
Low clarity
Moderate clarity
High clarity
02: Low clarity | 34: Moderate clarity | 56: High clarity
A score of 4 suggests moderately good awareness of your feelings in relationship moments, with occasional difficulty pinpointing or separating specific emotions under stress.
example score
3/6
Guilt and Shame (GaS)
Measures the tendency to feel guilt and shame when experiencing and expressing difficult emotions in the relationship context.
Low
Moderate
High
02: Low | 34: Moderate | 56: High
A score of 3 suggests a moderate tendency to experience guilt or shame around emotions, which may sometimes constrain open emotional expression with a partner.
Start Online Test
just completed the test
DATA-BASED USER COHORTS

Who Usually Takes This Test?

Couples in recurring conflict
44%OF USERS
People who keep having the same arguments and want to understand how they experience their partner’s response when they’re hurt, upset, or stressed.
Individuals feeling emotionally dismissed
33%OF USERS
People who feel judged, ignored, or misunderstood in their relationship and want clearer language for what happens when they share difficult emotions.
Therapy clients building connection
23%OF USERS
People in counseling who want a quick snapshot of emotional patterns in their relationship to set concrete goals for communication and trust.
BASED ON AGGREGATED, ANONYMIZED DATA FROM TENS OF THOUSANDS OF FREUDLY USERS.
Benchmarking

See How You Compare

Once you complete the test, your results are compared with real-world data from people in your country.
Below is a preview of how scores are typically distributed across each scale.
Rumination (R)
Rumination (R)
Average
2.9
Normal range
1.94
min.
0
max.
6
This curve shows how scores are typically distributed.
Once you complete the test, your result will appear on the scale so you can see how you compare.
Acceptance (A)
Acceptance (A)
Average
3
Normal range
2.23.8
min.
0
max.
6
This curve shows how scores are typically distributed.
Once you complete the test, your result will appear on the scale so you can see how you compare.
Duration (D)
Duration (D)
Average
2.4
Normal range
1.33.4
min.
0
max.
6
This curve shows how scores are typically distributed.
Once you complete the test, your result will appear on the scale so you can see how you compare.
Accusation (A)
Accusation (A)
Average
4.1
Normal range
3.34.9
min.
0
max.
6
This curve shows how scores are typically distributed.
Once you complete the test, your result will appear on the scale so you can see how you compare.
Expression (E)
Expression (E)
Average
3.6
Normal range
2.54.7
min.
0
max.
6
This curve shows how scores are typically distributed.
Once you complete the test, your result will appear on the scale so you can see how you compare.
Consensus (C)
Consensus (C)
Average
2.5
Normal range
1.63.5
min.
0
max.
6
This curve shows how scores are typically distributed.
Once you complete the test, your result will appear on the scale so you can see how you compare.
Rationality (R)
Rationality (R)
Average
3.7
Normal range
2.94.5
min.
0
max.
6
This curve shows how scores are typically distributed.
Once you complete the test, your result will appear on the scale so you can see how you compare.
Emotional Numbness (EN)
Average
2.7
Normal range
1.83.6
min.
0
max.
6
This curve shows how scores are typically distributed.
Once you complete the test, your result will appear on the scale so you can see how you compare.
Control (C)
Control (C)
Average
3.9
Normal range
34.8
min.
0
max.
6
This curve shows how scores are typically distributed.
Once you complete the test, your result will appear on the scale so you can see how you compare.
Values (V)
Values (V)
Average
1.6
Normal range
0.52.7
min.
0
max.
6
This curve shows how scores are typically distributed.
Once you complete the test, your result will appear on the scale so you can see how you compare.
Differentiation (D)
Differentiation (D)
Average
3.5
Normal range
2.44.5
min.
0
max.
6
This curve shows how scores are typically distributed.
Once you complete the test, your result will appear on the scale so you can see how you compare.
Validation (V)
Validation (V)
Average
3.1
Normal range
24.2
min.
0
max.
6
This curve shows how scores are typically distributed.
Once you complete the test, your result will appear on the scale so you can see how you compare.
Clarity (C)
Clarity (C)
Average
2.8
Normal range
1.73.9
min.
0
max.
6
This curve shows how scores are typically distributed.
Once you complete the test, your result will appear on the scale so you can see how you compare.
Guilt and Shame (GaS)
Average
2.1
Normal range
13.1
min.
0
max.
6
This curve shows how scores are typically distributed.
Once you complete the test, your result will appear on the scale so you can see how you compare.
Featured On
SAMPLE QUESTIONS

Example Questions From the Test

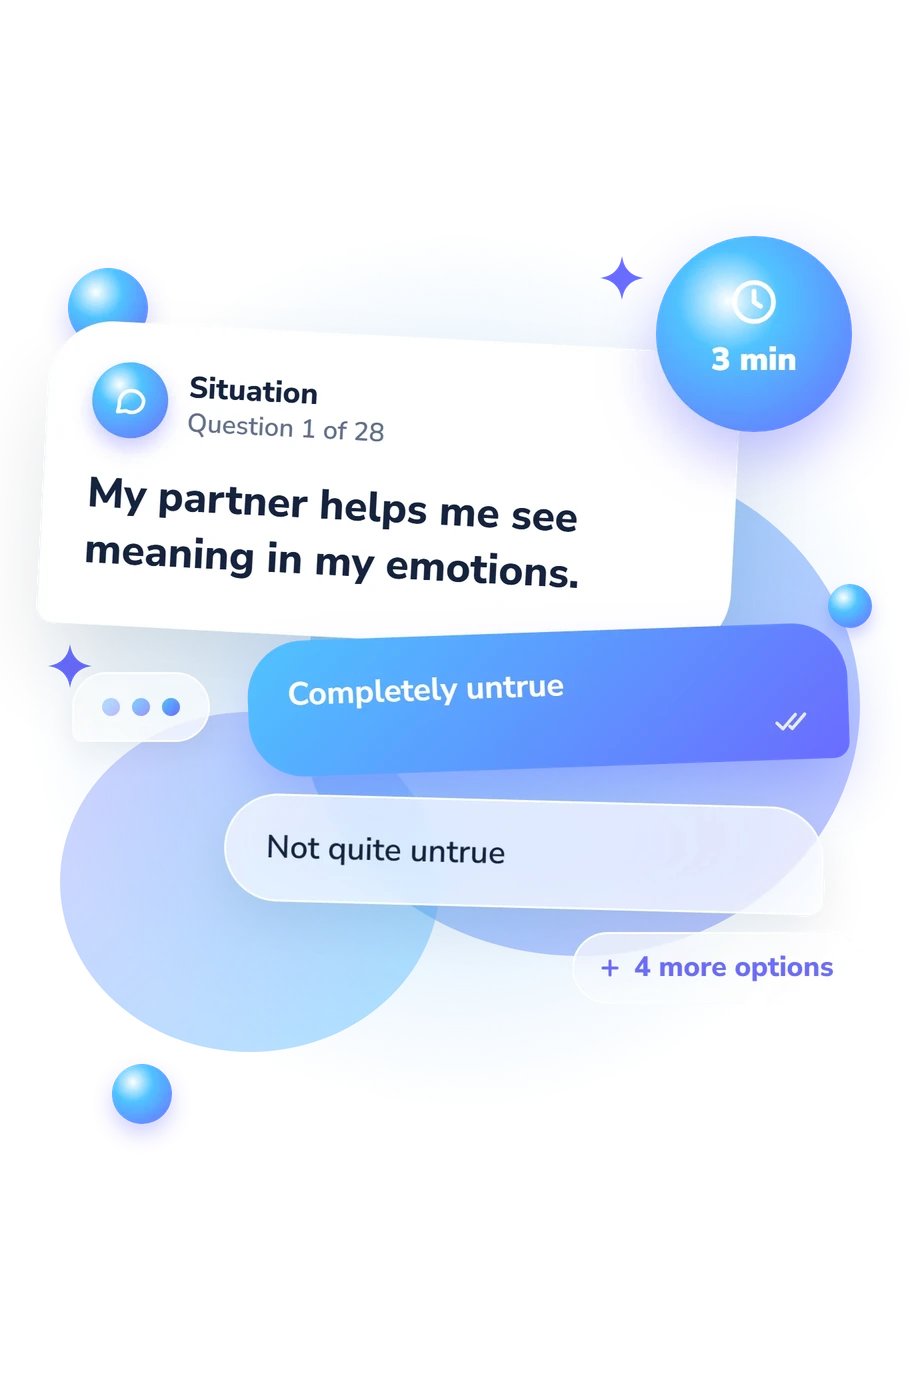
Please read each statement carefully and select the response that best reflects how you perceive your partner’s reaction to your emotions. Complete this questionnaire only if you have a partner.
    • Completely untrue
    • Not quite true
    • Somewhat untrue
    • Slightly true
    • Fairly true
    • Completely true
    • Completely untrue
    • Not quite true
    • Not completely untrue
    • Slightly true
    • Fairly true
    • Completely true
    • Completely untrue
    • Slightly untrue
    • Somewhat untrue
    • Slightly true
    • Quite true
    • Completely true
WHAT THE TEST MEASURES
About This Assessment
Emotional Schemas Scale in Relationships, RESS Test

Relationship Emotional Schemas Scale (RESS) Test - Symptoms and Signs

cbt
schematherapy

This brief self-report measure is designed to assess how an individual perceives a romantic partner’s responses to their emotional experience. The Relationship Emotional Schemas Scale (RESS) focuses on appraisals of how difficult feelings (e.g., hurt or distress) are received within the relationship, emphasizing the respondent’s subjective interpretation rather than objective partner behavior.

The instrument includes 14 items and typically takes about 3 minutes to complete. Items are intended to characterize perceived patterns such as acceptance, understanding, criticism, or invalidation in response to the respondent’s emotions, which may inform clinical case formulation and treatment planning for relationship-focused work. The Relationship Emotional Schemas Scale (RESS) is attributed to Susan M. Johnson and Robert L. Leahy.

Author: Robert L. Leahy, Susan M. Johnson
Literature: Leahy, R. L. Emotional schema therapy. Guilford Press. 2015.
Popular tests
Comments
Leave a Comment