
Acculturation Expectations Questionnaire Test
How the Scales are Structured
Who Usually Takes This Test?
See How You Compare
Below is a preview of how scores are typically distributed across each scale.
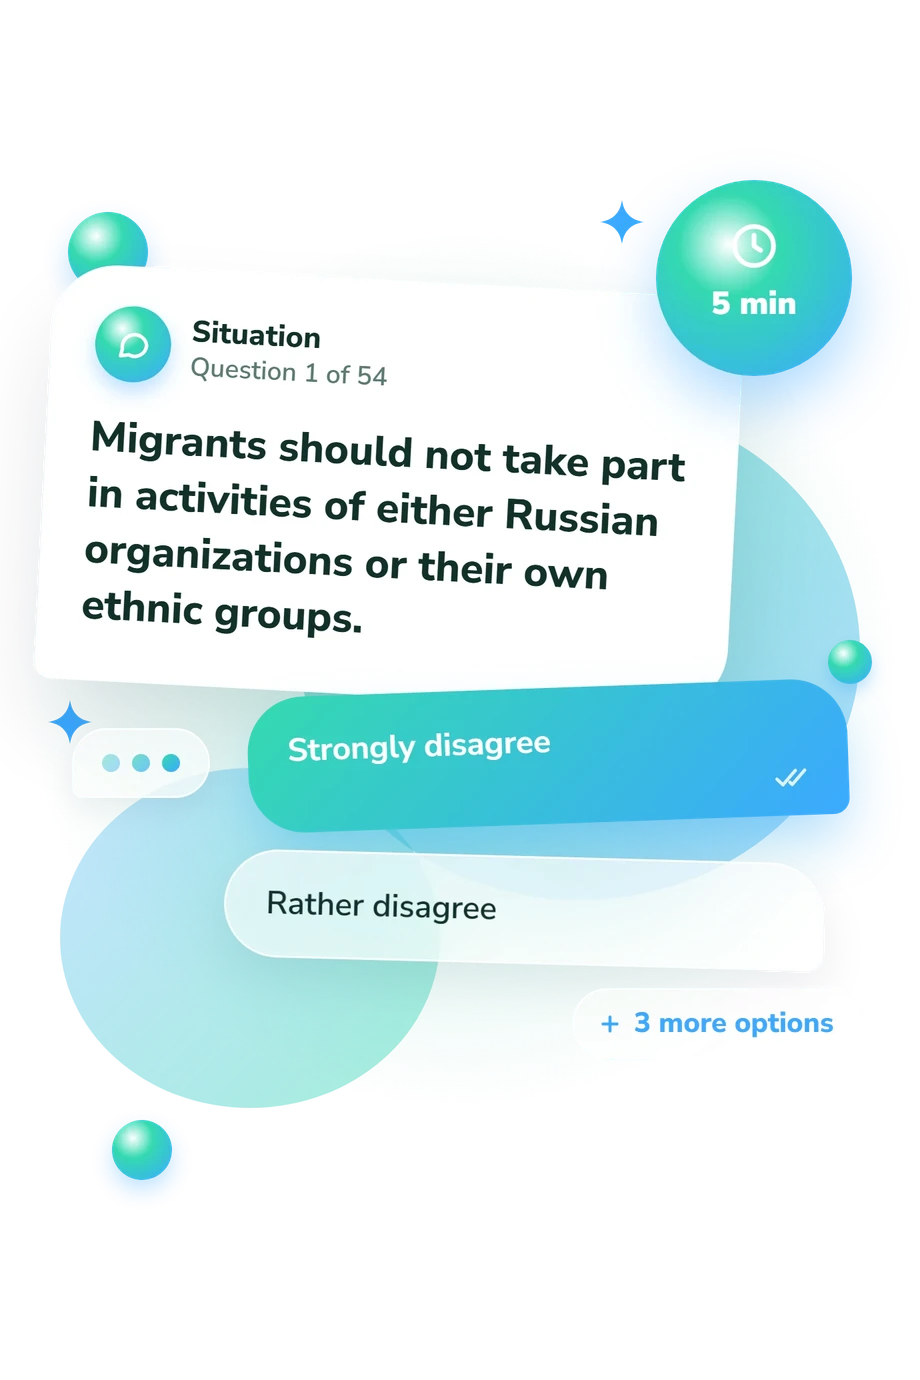
Example Questions From the Test
- Strongly disagree
- Somewhat disagree
- Don't know / not sure
- Agree
- Strongly agree
- Strongly disagree
- Rather disagree
- Don't know / not sure
- Agree
- Strongly agree
- Strongly disagree
- Rather disagree
- Do not know / not sure
- Agree
- Strongly agree
Acculturation Expectations Questionnaire Test - Description and methodology of the test
For readers examining their own views about migration and cultural coexistence, this assessment offers a structured way to consider expectations placed on migrants. The Acculturation Expectations Questionnaire Test translates those views into a profile of cultural replacement, exclusion from the host social environment, separation, and shared participation. As a migration attitudes questionnaire, it can support reflection in education, intercultural work, or personal discussion.
What This Assessment Explores
The questions examine how a receiving society expects migrants to relate to traditions and public life. This acculturation questionnaire covers language, friendships, marriage, education, residence, and work. Its profile shows whether migrants are expected to face replacement, an exclusionary stance, separation, or participation in both cultures.
The four dimensions are reported as follows:
- Assimilation (1-5) measures cultural replacement: Low assimilation expectation 1-1.7; Moderate assimilation expectation 1.8-3; High assimilation expectation 3.1-5.
- Exclusion (1-5) measures exclusion from the host social environment: Low exclusion 1-1.2; Moderate 1.3-2.5; High 2.6-5.
- Segregation (1-5) measures preference for isolation: Low expectation of segregation 1-1.5; Moderate 1.6-2.8; High 2.9-5.
- Integration (1-5) measures support for cultural continuity and participation: Low 1-3.4; High 3.5-5.
Higher scores indicate stronger endorsement of the named expectation; lower integration scores indicate its rejection.
Methodology and Scientific Basis
Responses use a five-point agreement format, from strong disagreement to strong agreement, with a not-sure midpoint. Items judge situations involving workplaces, schools, friendships, marriages, neighborhoods, language, and cultural traditions. The task therefore captures attitudes toward social arrangements rather than factual knowledge.
Scoring is dimension-specific: answers generate separate profile results, and higher values indicate stronger endorsement of the relevant expectation. The displayed bands are raw score categories, while this online questionnaire has no established population norms or stated standardisation for its scoring.
The questionnaire is conceptually consistent with Berry’s Acculturation Expectations Measure, discussed by Lepshokova and Tatarko (2017), but is not an adaptation of that published measure. Berry’s acculturation framework (1997) and plural-society work by Berry, Kim, Power, Young, and Bujaki (1989) provide its theoretical context. Berry, Phinney, Sam, and Vedder (2006) connect acculturation with identity and adaptation.
As an acculturation attitudes questionnaire, it records stated preferences at one moment. Social desirability, current experience, cultural context, and self-awareness can shape answers, so the profile is best read as structured reflection rather than a standalone account of conduct.
- Zarina K. Lepshokova and Alexander N. Tatarko (2017). Adaptation and modification of John Berry’s measure of acculturation expectations. Social Psychology and Society, 8(3), 125-146. 10.17759/sps.2017080310
- John W. Berry, Jean S. Phinney, David L. Sam, and Paul Vedder (2006). Immigrant Youth: Acculturation, Identity, and Adaptation. Applied Psychology, 55(3), 303-332. 10.1111/j.1464-0597.2006.00256.x
- John W. Berry (1997). Immigration, Acculturation, and Adaptation. Applied Psychology, 46(1), 5-34. 10.1111/j.1464-0597.1997.tb01087.x
- John W. Berry, U. Kim, S. Power, M. Young, and M. Bujaki (1989). Acculturation Attitudes in Plural Societies. Applied Psychology, 38(2), 185-206. 10.1111/j.1464-0597.1989.tb01208.x
Updated: