
Modified Personality Inventory (PID-5-BF+M) Test
Understand key maladaptive personality traits and DSM 5 related risk patterns in about 7 minutes. Get a fast, clinically useful snapshot for diagnosis, treatment planning, and tracking change.


08:30
Scale Explorer
How the Scales are Structured
DATA-BASED USER COHORTS
Who Usually Takes This Test?
BASED ON AGGREGATED, ANONYMIZED DATA FROM TENS OF THOUSANDS OF FREUDLY USERS.
Benchmarking
See How You Compare
Once you complete the test, your results are compared with real-world data from people in your country.
Below is a preview of how scores are typically distributed across each scale.
Deceptiveness (D)
Deceptiveness (D)
Average
2.3
Normal range
1.4 — 3.2
min.
0
max.
6
This curve shows how scores are typically distributed.
Once you complete the test, your result will appear on the scale so you can see how you compare.
Manipulativeness (M)
Average
3.5
Normal range
2.4 — 4.6
min.
0
max.
6
This curve shows how scores are typically distributed.
Once you complete the test, your result will appear on the scale so you can see how you compare.
Antagonism (A)
Antagonism (A)
Average
1.8
Normal range
0.7 — 3
min.
0
max.
6
This curve shows how scores are typically distributed.
Once you complete the test, your result will appear on the scale so you can see how you compare.
Distractibility (D)
Distractibility (D)
Average
2.6
Normal range
1.8 — 3.4
min.
0
max.
6
This curve shows how scores are typically distributed.
Once you complete the test, your result will appear on the scale so you can see how you compare.
Impulsivity (I)
Impulsivity (I)
Average
2.8
Normal range
1.7 — 3.9
min.
0
max.
6
This curve shows how scores are typically distributed.
Once you complete the test, your result will appear on the scale so you can see how you compare.
Irresponsibility (I)
Average
2.6
Normal range
1.7 — 3.5
min.
0
max.
6
This curve shows how scores are typically distributed.
Once you complete the test, your result will appear on the scale so you can see how you compare.
Avoidance of Intimacy (AoI)
Average
2.6
Normal range
1.8 — 3.5
min.
0
max.
6
This curve shows how scores are typically distributed.
Once you complete the test, your result will appear on the scale so you can see how you compare.
Anhedonia (A)
Anhedonia (A)
Average
3.5
Normal range
2.4 — 4.5
min.
0
max.
6
This curve shows how scores are typically distributed.
Once you complete the test, your result will appear on the scale so you can see how you compare.
Detachment (D)
Detachment (D)
Average
2.8
Normal range
1.8 — 3.8
min.
0
max.
6
This curve shows how scores are typically distributed.
Once you complete the test, your result will appear on the scale so you can see how you compare.
Alienation (A)
Alienation (A)
Average
4.3
Normal range
3.5 — 5
min.
0
max.
6
This curve shows how scores are typically distributed.
Once you complete the test, your result will appear on the scale so you can see how you compare.
Fear of Separation (FoS)
Average
4.5
Normal range
3.6 — 5.3
min.
0
max.
6
This curve shows how scores are typically distributed.
Once you complete the test, your result will appear on the scale so you can see how you compare.
Anxiety (A)
Anxiety (A)
Average
3.9
Normal range
3.2 — 4.7
min.
0
max.
6
This curve shows how scores are typically distributed.
Once you complete the test, your result will appear on the scale so you can see how you compare.
Emotional lability (El)
Average
2.1
Normal range
1.2 — 3.1
min.
0
max.
6
This curve shows how scores are typically distributed.
Once you complete the test, your result will appear on the scale so you can see how you compare.
Negative effect (Ne)
Average
4.2
Normal range
3.2 — 5.2
min.
0
max.
6
This curve shows how scores are typically distributed.
Once you complete the test, your result will appear on the scale so you can see how you compare.
Disinhibition/Uninhibited Behavior (DB)
Average
3.5
Normal range
2.5 — 4.5
min.
0
max.
6
This curve shows how scores are typically distributed.
Once you complete the test, your result will appear on the scale so you can see how you compare.
Grandiosity (G)
Grandiosity (G)
Average
2.1
Normal range
1.3 — 2.9
min.
0
max.
6
This curve shows how scores are typically distributed.
Once you complete the test, your result will appear on the scale so you can see how you compare.
Perfectionism (P)
Perfectionism (P)
Average
2.8
Normal range
1.8 — 3.7
min.
0
max.
6
This curve shows how scores are typically distributed.
Once you complete the test, your result will appear on the scale so you can see how you compare.
Anankastia (A)
Anankastia (A)
Average
4.3
Normal range
3.2 — 5.4
min.
0
max.
6
This curve shows how scores are typically distributed.
Once you complete the test, your result will appear on the scale so you can see how you compare.
Dysregulation (D)
Dysregulation (D)
Average
2.5
Normal range
1.4 — 3.5
min.
0
max.
6
This curve shows how scores are typically distributed.
Once you complete the test, your result will appear on the scale so you can see how you compare.
Eccentricity (E)
Eccentricity (E)
Average
2.8
Normal range
1.7 — 3.9
min.
0
max.
6
This curve shows how scores are typically distributed.
Once you complete the test, your result will appear on the scale so you can see how you compare.
Unusual Beliefs (UB)
Average
3
Normal range
1.9 — 4.1
min.
0
max.
6
This curve shows how scores are typically distributed.
Once you complete the test, your result will appear on the scale so you can see how you compare.
Psychoticism (P)
Psychoticism (P)
Average
2.3
Normal range
1.3 — 3.3
min.
0
max.
6
This curve shows how scores are typically distributed.
Once you complete the test, your result will appear on the scale so you can see how you compare.
Love of order (Loo)
Love of order (Loo)
Average
2.4
Normal range
1.5 — 3.3
min.
0
max.
6
This curve shows how scores are typically distributed.
Once you complete the test, your result will appear on the scale so you can see how you compare.
Rigidity (R)
Rigidity (R)
Average
4
Normal range
3 — 5
min.
0
max.
6
This curve shows how scores are typically distributed.
Once you complete the test, your result will appear on the scale so you can see how you compare.
Featured On
SAMPLE QUESTIONS
Example Questions From the Test
Below is a list of statements that different people may use to describe themselves. We are interested in how you would describe yourself. There are no “right” or “wrong” answers. Take your time, read each statement carefully, and select the response that most accurately describes you.
- Very false or often false
- Sometimes or somewhat false
- Sometimes or somewhat true
- Very true or often true
- Very false or often false
- Sometimes or somewhat false
- Sometimes or somewhat true
- Very true or often true
- Completely untrue or often untrue
- Sometimes or somewhat untrue
- Sometimes or somewhat true
- Completely true or often true
WHAT THE TEST MEASURES
About This Assessment
/https://cdn.freudly.ai/media/tests/744/image/1761490973_day_image_20251026_150252.png)
Modified Personality Inventory (PID-5-BF+M) Test - Symptoms and Signs
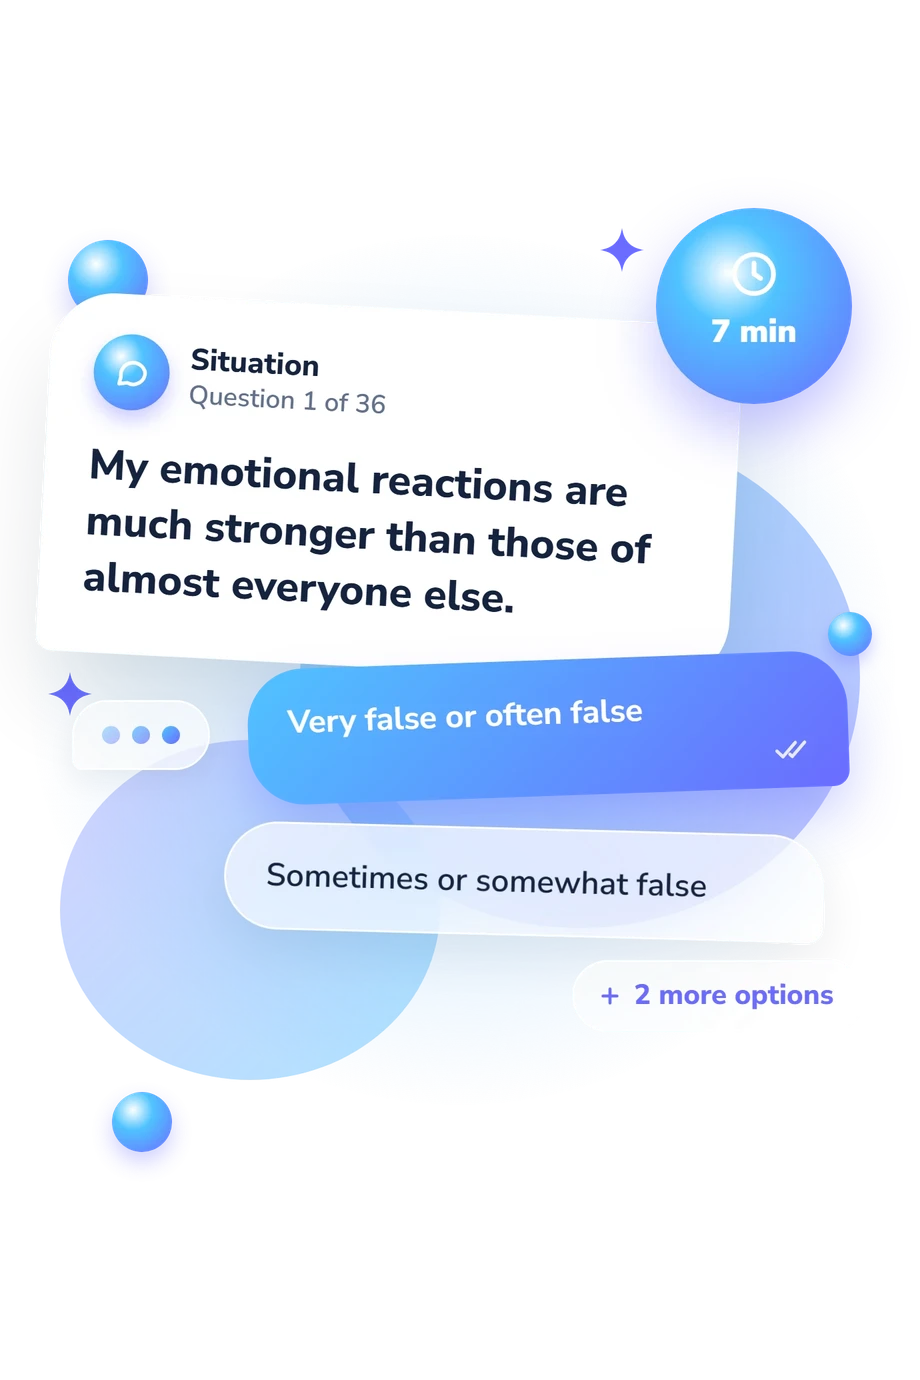
In settings where a brief screening of maladaptive personality trait dimensions is needed, the Modified Personality Inventory (PID-5-BF+M) provides a structured self-report format. It includes 36 items and typically takes about 7 minutes to complete.
Developed by A. E. Krueger, R. F. Krueger, and L. J. Simms, it is intended to assess core pathological trait domains aligned with contemporary diagnostic models and may support case formulation, treatment planning, and monitoring of change over time. The Modified Personality Inventory (PID-5-BF+M) is not a stand-alone diagnostic instrument; results should be interpreted in conjunction with clinical interview, history, and other assessment data.
Author: A. E. Krueger, L. J. Simms, R. F. Krueger
Literature: Krueger, R. F., Derringer, J., Markon, K. E., Watson, D., & Skodol, A. E. Initial construction of a maladaptive personality trait model and inventory for DSM-5. Psychological Medicine. 2012.; Bach, B., & Sellbom, M. Continuity between DSM-5 categorical criteria and traits in the personality inventory for DSM-5 (PID-5). Journal of Personality Assessment. 2016.; Bach, B., Kerber, A., Aluja, A., Bastiaens, T., Keeley, J., Claes, L., Fossati, A., Gutierrez, F., Oliveira, S. E. S., Pires, R., Riegel, K. D., Rolland, J., Roskam, I., Sellbom, M., Somma, A., Spanemberg, L., Strus, W., Thimm, J., Wright, A. G. C., & Zimmermann, J. International assessment of DSM-5 and ICD-11 personality disorder traits: Toward a common nosology in DSM-5.1. Psychopathology. 2019.; Zimmermann, J., Kerber, A., Rek, K., Hopwood, C. J., & Krueger, R. F. A brief but comprehensive measure of maladaptive personality traits: The PID-5 brief form. Psychological Assessment. 2019.
Popular tests
Comments
Leave a Comment