
Freudly+971 508685814hello@freudly.ai
Freudly
attitude towards illness

Illness Social Significance Self-Assessment Questionnaire Test
Take the online Illness Social Significance Self-Assessment Questionnaire Test - AI psychologist FreudlyYou can take Illness Social Significance Self-Assessment Questionnaire Testhere. Online version of a simple and accurate psychological test with interpretation.en
Understand how illness is affecting your social life and status in about 2 minutes. A 10 item score makes it easy to spot hidden challenges and track change over time.
Start Online Test
Questions: 102 minutes
08:30
October 2, 2025
October 2, 2025
Material has been updated
October 2, 2025
Material has been published
25,853 views
1,794 completions
1,563 likes
Verified by Daniel Hall
Psychologist with 25 years of experience
Share
Scale Explorer

How the Scales are Structured

example score
4/5
Financial Loss (FL)
Measures perceived financial losses and material impact associated with the illness.
Low impact
Moderate impact
High impact
01: Low impact | 23: Moderate impact | 45: High impact
A score of 4 suggests the illness is perceived as having a high material impact, with notable financial strain or losses.
example score
3/5
Development of Feelings of Inferiority (DoFoI)
Measures how strongly the person feels personal inferiority related to their illness in social contexts.
Low
Moderate
High
01: Low | 23: Moderate | 45: High
A score of 3 falls in the Moderate range, suggesting a noticeable but not extreme sense of personal inadequacy linked to the illness.
example score
2/5
Reduced Physical Attractiveness (RPA)
Assesses how strongly a person feels their illness has reduced their appearance and physical attractiveness.
Low impact
Moderate impact
High impact
01: Low impact | 23: Moderate impact | 45: High impact
A score of 2 suggests a moderate perceived impact of illness on physical attractiveness, with some associated discomfort but not severe distress.
example score
4/5
Inability to Pursue a Career (ItPaC)
Assesses how strongly illness-related limitations are perceived to restrict career development and professional advancement.
Low impact
Moderate impact
High impact
01: Low impact | 23: Moderate impact | 45: High impact
A score of 4 indicates a high perceived impact of the illness on career prospects and professional self-identity.
example score
3/5
Leisure Time Restriction (LTR)
Measures how much illness restricts leisure activities and available free time.
Low limitation
Moderate limitation
High limitation
01: Low limitation | 23: Moderate limitation | 45: High limitation
A score of 3 indicates a moderate level of illness-related restriction of free time, with noticeable but not maximal impact on relaxation and personal interests.
example score
4/5
Deterioration of Workplace Relationships (DoWR)
Measures how much the illness is perceived to worsen professional relationships and the workplace atmosphere.
Minimal impact
Noticeable impact
Strong impact
01: Minimal impact | 23: Noticeable impact | 45: Strong impact
A score of 4 indicates a strong perceived negative impact of the illness on relationships at work and the overall workplace climate.
example score
3/5
Withdrawal From Pleasures (WFP)
Measures how much illness limits a person’s ability to enjoy their usual pleasures and everyday joys.
Minimal limits
Noticeable limits
Strong limits
01: Minimal limits | 23: Noticeable limits | 45: Strong limits
A score of 3 indicates noticeable limitations in customary pleasures, suggesting a meaningful reduction in perceived day-to-day enjoyment.
example score
3/5
Deterioration of Family Relationships (DoFR)
Measures the extent to which illness is perceived to strain or disrupt relationships with family members.
Minimal impact
Moderate difficulties
Severe difficulties
01: Minimal impact | 23: Moderate difficulties | 45: Severe difficulties
A score of 3 indicates a moderate level of illness-related difficulties in family relationships.
example score
2/5
Perceived Loss of Strength and Energy (PLoSaE)
Measures how strongly the illness is associated with a subjective loss of vitality and energy in daily functioning.
Low impact
Moderate impact
High impact
01: Low impact | 23: Moderate impact | 45: High impact
A score of 2 indicates a moderate perceived loss of strength and energy associated with the illness, with some impact on physical well-being and activity.
example score
3/5
Social Interaction Restriction (SIR)
Assesses how much the illness limits a person’s social contacts and everyday communication.
Minimal restriction
Moderate restriction
Severe restriction
01: Minimal restriction | 23: Moderate restriction | 45: Severe restriction
A score of 3 indicates a moderate level of communication restriction, suggesting noticeable but not extreme limitations in social interaction due to the illness.
Start Online Test
just completed the test
DATA-BASED USER COHORTS

Who Usually Takes This Test?

People with chronic illness
46%OF USERS
They take it to understand how a long-term condition is changing their role at work, in the family, and in social circles.
Recently diagnosed patients
32%OF USERS
They use it to quickly gauge how a new diagnosis is affecting confidence, communication, and how others treat them.
Rehab and disability applicants
22%OF USERS
They take it to document social and occupational difficulties related to illness when seeking accommodations or support.
BASED ON AGGREGATED, ANONYMIZED DATA FROM TENS OF THOUSANDS OF FREUDLY USERS.
Benchmarking

See How You Compare

Once you complete the test, your results are compared with real-world data from people in your country.
Below is a preview of how scores are typically distributed across each scale.
Material damage (Md)
Average
1.7
Normal range
12.5
min.
0
max.
5
This curve shows how scores are typically distributed.
Once you complete the test, your result will appear on the scale so you can see how you compare.
Developing a Sense of Inferiority (DaSoI)
Average
2
Normal range
1.12.9
min.
0
max.
5
This curve shows how scores are typically distributed.
Once you complete the test, your result will appear on the scale so you can see how you compare.
Decreased physical attractiveness (Dpa)
Average
3.1
Normal range
2.33.8
min.
0
max.
5
This curve shows how scores are typically distributed.
Once you complete the test, your result will appear on the scale so you can see how you compare.
Inability to Build a Career (ItBaC)
Average
2
Normal range
1.22.9
min.
0
max.
5
This curve shows how scores are typically distributed.
Once you complete the test, your result will appear on the scale so you can see how you compare.
Limitation of free time (Loft)
Average
2.7
Normal range
2.13.4
min.
0
max.
5
This curve shows how scores are typically distributed.
Once you complete the test, your result will appear on the scale so you can see how you compare.
Worsening Relationship at Work (WRaW)
Average
3.1
Normal range
2.33.9
min.
0
max.
5
This curve shows how scores are typically distributed.
Once you complete the test, your result will appear on the scale so you can see how you compare.
Renouncing Pleasures (RP)
Average
3.3
Normal range
2.63.9
min.
0
max.
5
This curve shows how scores are typically distributed.
Once you complete the test, your result will appear on the scale so you can see how you compare.
Deterioration of family relationships (Dofr)
Average
2.9
Normal range
23.9
min.
0
max.
5
This curve shows how scores are typically distributed.
Once you complete the test, your result will appear on the scale so you can see how you compare.
Feeling of loss of strength and energy (Folosae)
Average
1.4
Normal range
0.52.3
min.
0
max.
5
This curve shows how scores are typically distributed.
Once you complete the test, your result will appear on the scale so you can see how you compare.
Communication Restrictions (CR)
Average
3
Normal range
23.9
min.
0
max.
5
This curve shows how scores are typically distributed.
Once you complete the test, your result will appear on the scale so you can see how you compare.
Featured On
SAMPLE QUESTIONS

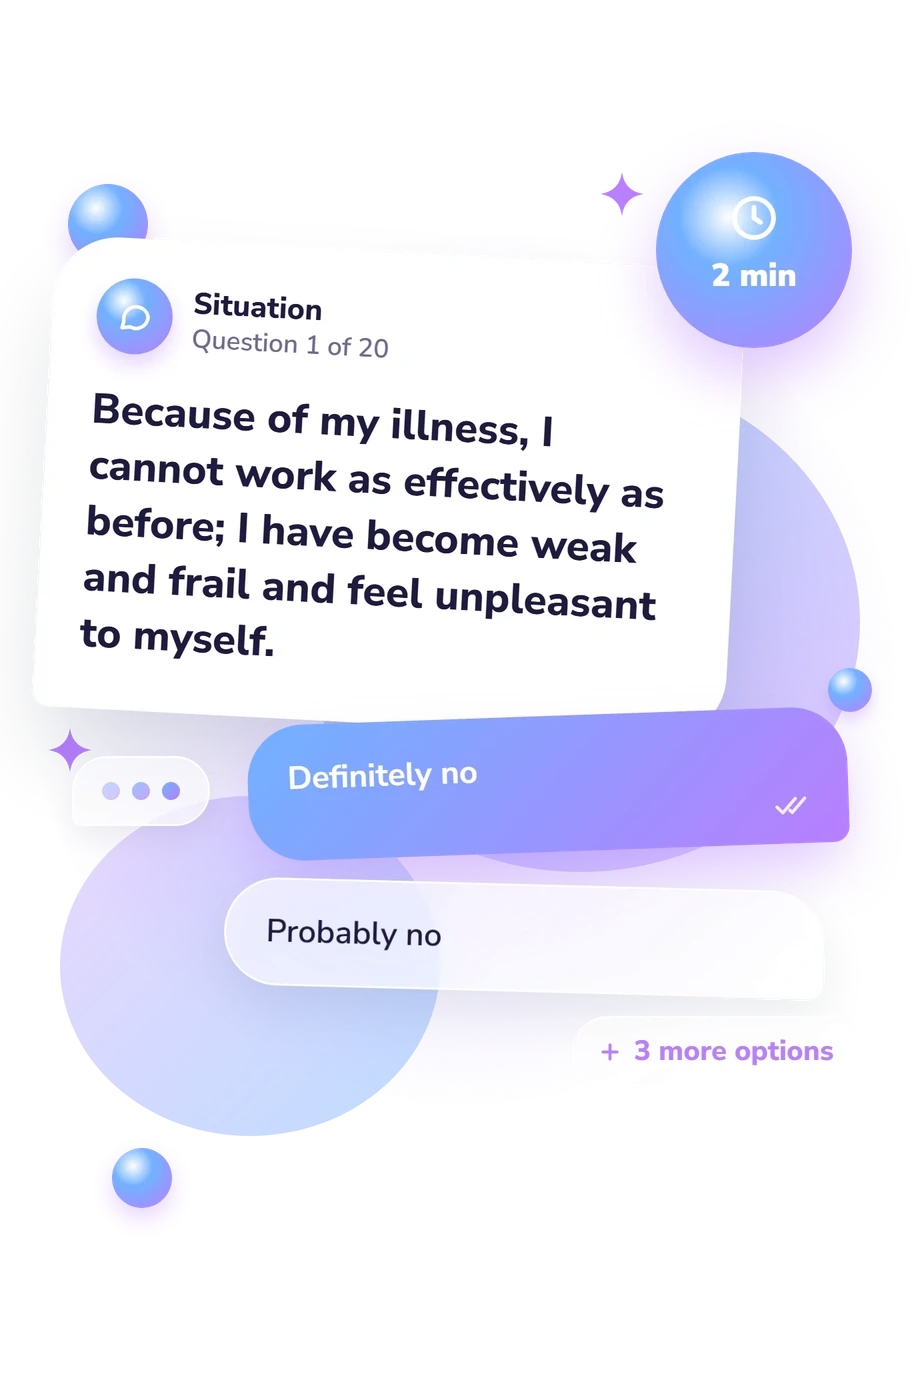
Example Questions From the Test

    • Definitely not
    • Probably not
    • Not sure
    • Probably yes
    • Definitely yes
    • Definitely not
    • Probably not
    • Not sure
    • Probably yes
    • Definitely yes
    • Definitely not
    • Probably not
    • Not sure
    • Probably yes
    • Definitely yes
WHAT THE TEST MEASURES
About This Assessment
Questionnaire for Self-Assessment of the Social Significance of Illness Test

Illness Social Significance Self-Assessment Questionnaire Test - Symptoms and Signs

attitude towards illness

This self-report measure assesses the perceived social impact of illness on an individual’s role functioning and social standing. The Illness Social Significance Self-Assessment Questionnaire is designed to capture how a health condition may influence everyday social interactions and participation.

The instrument includes 10 items and typically requires about 2 minutes to complete. Items ask respondents to rate the extent to which illness affects domains such as work, relationships, and perceived reactions from others, yielding a brief quantitative index that can be used for clinical screening or research. The Illness Social Significance Self-Assessment Questionnaire is attributed to Howard Leventhal.

Author: Howard Leventhal
Literature: Leventhal, H., Meyer, D., & Nerenz, D. The common sense representation of illness danger. In S. Rachman (Ed.), Medical psychology (Vol. 2). Pergamon Press. 1980.
Popular tests
Comments
Leave a Comment