
Social Frustration Level Scale Test
How the Scales are Structured
Who Usually Takes This Test?
See How You Compare
Below is a preview of how scores are typically distributed across each scale.
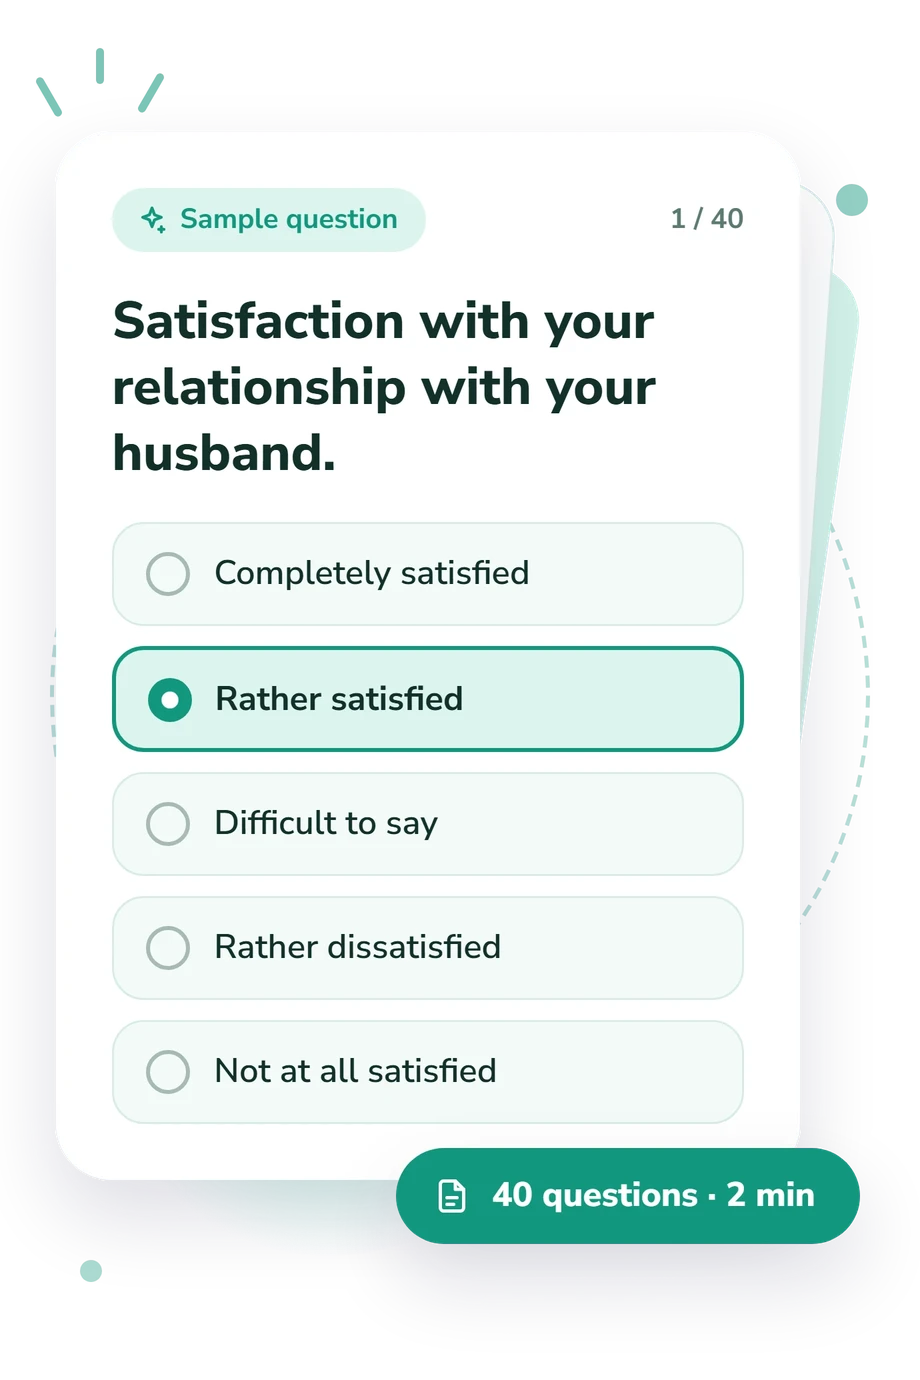
Example Questions From the Test
- Completely satisfied
- Rather satisfied
- Hard to say
- Rather dissatisfied
- Completely dissatisfied
- Completely satisfied
- Rather satisfied
- Difficult to say
- Rather dissatisfied
- Completely dissatisfied
- Completely satisfied
- Rather satisfied
- Difficult to say
- Rather dissatisfied
- Not at all satisfied
Social Frustration Level Scale Test - Description and methodology of the test
People considering whether current dissatisfaction warrants closer reflection may find the Social Frustration Level Scale Test useful. This social frustration questionnaire is intended for adults who want a structured way to consider their circumstances. It can support a focused decision about which parts of daily life to examine further.
What This Assessment Explores
The questionnaire examines dissatisfaction across circumstances affecting social functioning, including relationships, work, finances, health, and social position. This social frustration scale shows where experience falls short of expectations.
The displayed result combines five domains with an overall score:
- Health and Work Capacity (1-5) measures health and work dissatisfaction.
- Socioeconomic Status (1-5) measures dissatisfaction with material and living conditions.
- Social Status (1-5) measures dissatisfaction with occupational and public standing.
- Social Environment (1-5) measures dissatisfaction in relationships with friends, colleagues, and acquaintances.
- Relationships With Family and Close Others (1-5) measures dissatisfaction and tension in close relationships.
- Overall Social Frustration Level (1-5) measures dissatisfaction with social hierarchy, status, and relationships.
The five domain scales show Low dissatisfaction 1-2.4, Moderate dissatisfaction 2.5-3.4, or High dissatisfaction 3.5-5. The overall scale shows Low 1-2.4, Moderate 2.5-3.4, or High 3.5-5.
Methodology and Scientific Basis
Each item uses five ordered response options, moving from complete satisfaction through an uncertain middle choice to complete dissatisfaction. Higher selected values therefore represent greater dissatisfaction, while the resulting profile shows whether strain is concentrated in one area or spread across several areas.
The questionnaire is conceptually consistent with Level of Social Frustration (Wasserman et al., 2004), related work by Wasserman et al. (2014), and the 2024 Social Frustration Level Questionnaire study. It should not be called an adaptation of that instrument; no standardization or normative status is stated for this online version.
Choices move from satisfaction to dissatisfaction; higher selections correspond to higher displayed scores. Results use the band shown for each scale. This social frustration test can help prioritize reflection, especially when one result area is noticeably higher than the others.
Because responses are self-reported, current mood, comparison standards, memory, and willingness to disclose can influence scores. The result is a snapshot of perceived dissatisfaction, not a diagnosis or a substitute for broader psychological assessment.
- Wasserman, L. I., Iovlev, B. V., & Berebin, M. A. (2004). Methodology for psychological diagnostics of the level of social frustration and its practical application. St. Petersburg: V. M. Bekhterev Psychoneurological Research Institute, 25 pp.
- Wasserman, L. I., Berebin, M. A., & Iovlev, B. V. (2014). Psychological diagnostics of social frustration level. In L. I. Wasserman & O. Yu. Shchelkova (Eds.), Psychological diagnostics of emotional and personality disorders (pp. 187-213). St. Petersburg: Skifia-print.
- Wasserman, L. I., Shchelkova, O. Yu., Dubinina, E. A., Mikhailov, V. A., Nikiforova, E. A., & Chugunov, D. N. (2024). Social Frustration Level Questionnaire: Substantiation, Design, and Probation. SibScript, 26(5), 659-671. 10.21603/sibscript-2024-26-5-659-671
Updated: