
Perceived Stress Scale for Children (PSS-C) Test
How the Scales are Structured
Who Usually Takes This Test?
See How You Compare
Below is a preview of how scores are typically distributed across each scale.
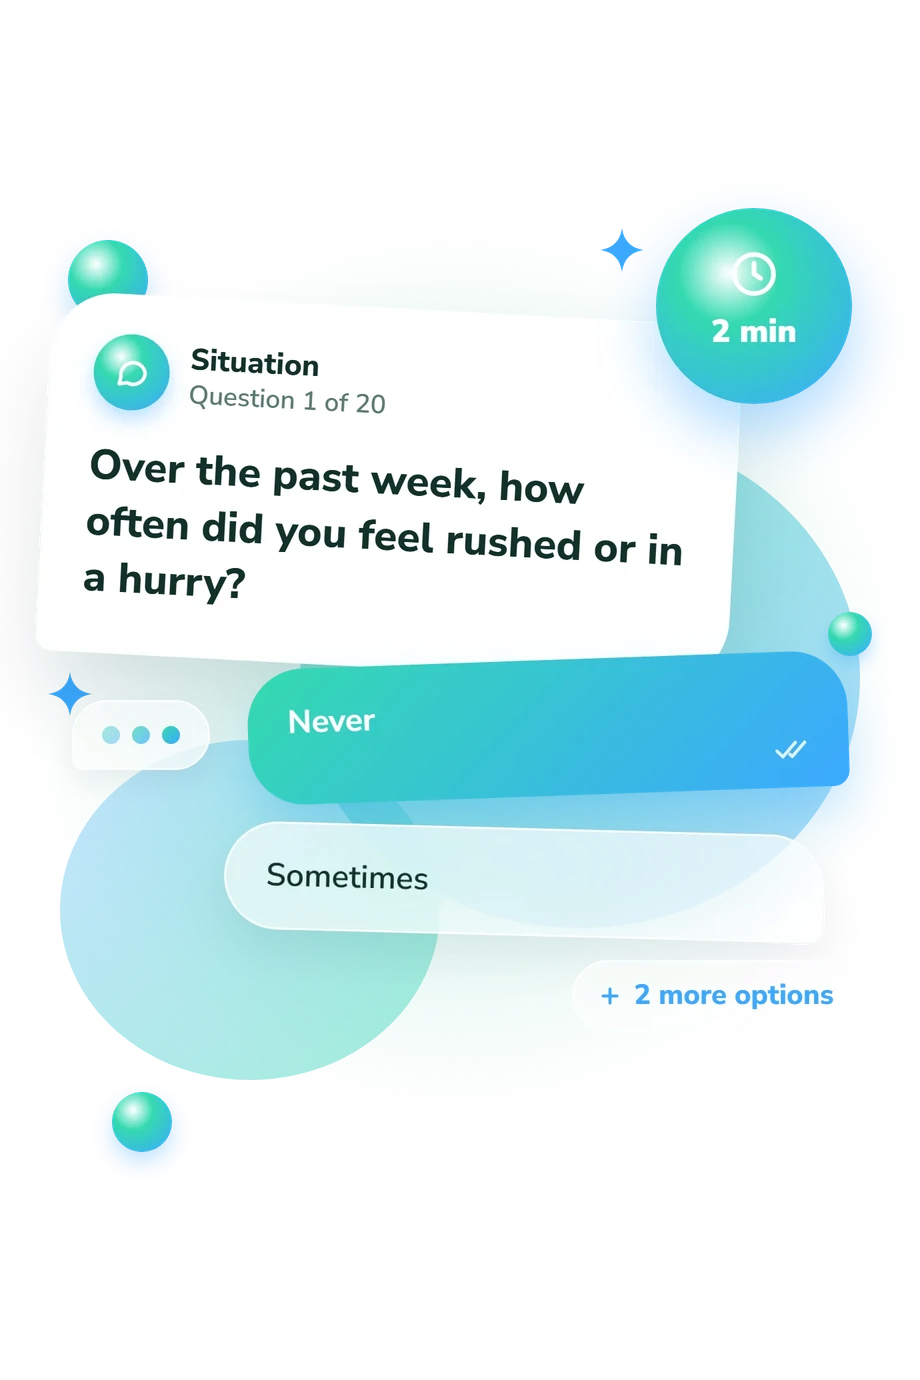
Example Questions From the Test
- Never
- Sometimes
- Quite often
- All the time or almost all the time
- Never
- Sometimes
- Fairly often
- All the time or almost all the time
- Never
- Sometimes
- Fairly often
- All the time or almost all the time
Perceived Stress Scale for Children (PSS-C) Test - Description and methodology of the test
Children and the adults supporting them can use the Perceived Stress Scale for Children (PSS-C) Test to organize recent experiences of pressure, worry, support, and positive emotion. As a child stress assessment, it suits a child who can answer simple questions about the past week, as well as a parent, caregiver, or professional helping with reflection. The result highlights patterns rather than a single upsetting moment.
What This Assessment Explores
Items ask how often a child felt hurried, overloaded, upset, nervous, angry, happy, supported by parents or guardians, or involved in arguments and play. They treat positive experiences and distress as separate dimensions, while a separate index compares the balance of stressful and positive events. As a test of perceived stress in children, the profile makes pressure points and supportive resources easier to discuss.
The displayed dimensions are:
- General Well-Being (1-4) measures positive events and feelings: Low well-being 1-2.7; Moderate well-being 2.71-3.62; High well-being 3.63-4.
- Distress (1-4) measures negative emotional experiences and stressful events: Low distress 1-1.5; Moderate distress 1.6-2.8; High distress 2.9-4.
- Perceived Stress Index (0-4) measures the ratio of stressful to positive events: Positive events predominate 0-0.9; Mixed / balanced 0.9-1; Stressful events predominate 1-4.
Methodology and Scientific Basis
This brief, frequency-based child self-report questionnaire covers the past week and offers four choices: Never, Sometimes, Fairly often, or All the time or almost all the time. The wording covers pressure, emotional reactions, family support, and social activity. The online scoring displays three dimensions, but answer-to-score weighting is not specified; interpretation should follow the profile rather than an invented point-by-point formula.
The closest published source is White's 2014 pilot study of the PSS-C, a child-focused measure. Kornienko, Rudnova, and Tarasova (2024) later examined PSS-C psychometric properties. This perceived stress questionnaire for children is conceptually consistent with those works; for this online form, norms and item-to-score weighting are not stated. Cohen, Kamarck, and Mermelstein (1983) provide the broader perceived-stress framework, while their adult scale does not show that this version reproduces it.
Interpretation depends on honest recall and the child's current week. Conflict, major change, or an unusually positive event may influence answers, and younger respondents may need neutral help with wording. Scores are not a diagnosis; consider them alongside conversation, observation, and fuller assessment when concerns persist.
- White, Barbara Prudhomme. (2014). The Perceived Stress Scale for Children: A Pilot Study in a Sample of 153 Children. International Journal of Pediatrics and Child Health, 2(2), 45-52. 10.12974/2311-8687.2014.02.02.4
- Kornienko, Dmitriy S., Rudnova, Natalia A., and Tarasova, Kristina S. (2024). Psychometric Properties of the Perceived Stress Scale for Children (PSS-C). Clinical Psychology and Special Education, 13(2), 129-146. 10.17759/cpse.2024130208
- Cohen, Sheldon, Kamarck, Tom, and Mermelstein, Robin. (1983). A Global Measure of Perceived Stress. Journal of Health and Social Behavior, 24(4), 385-396. 10.2307/2136404
Updated: