
Childhood Autism Rating Scale (CARS) Test
How the Scales are Structured
Who Usually Takes This Test?
See How You Compare
Below is a preview of how scores are typically distributed across each scale.
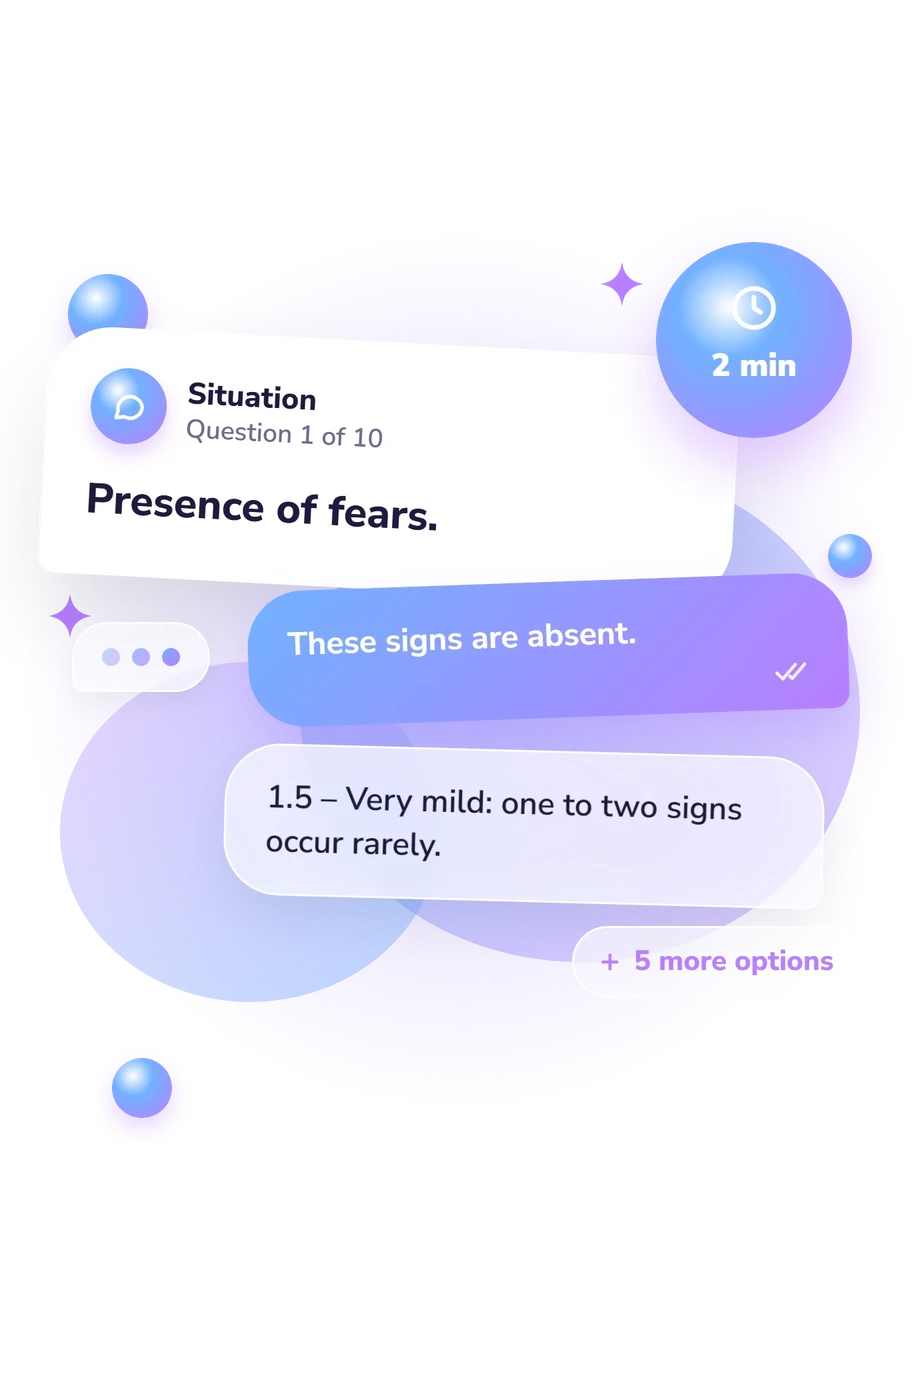
Example Questions From the Test
- These signs are absent.
- 5 – Shows one to two of the listed signs very rarely; otherwise behavior remains within normal limits.
- Three to four signs are present but the child does not show them in all situations.
- 5 – One to two signs are clearly present and occur often.
- Three to four signs are clearly present and occur often.
- 5 – These signs make contact with the child intermittent and mostly productive only for activities the child currently wants to do.
- These signs make contact with the child impossible for engaging them in purposeful activity.
- No signs of impairment are present.
- 5 – Shows 1–2 of the listed signs very rarely; otherwise behavior remains within normal limits.
- Three or four signs are present, but the child does not show them in all situations.
- 5 – One or two signs are clearly present and occur often.
- The signs are fully present and constant, but with adult persistence the child can repeat something or follow instructions.
- 5 – These signs make the child productive only in the activity the child wants to do at the moment.
- These signs indicate that the child cannot be engaged in shared activity.
- These features are absent.
- 5 – Shows one to two of the listed features very rarely; otherwise behavior remains within normal limits.
- Three to four features are observed, and the child does not show them in all situations.
- 5 – One to two features are clearly present and occur often.
- These features are present fully and consistently, but with persistent adult guidance the child can correct behavior and follow rules; however, without organizing influence the child again ignores rules.
- 5 – These features make it difficult to attend public events with the child or for the child to be in a group of children.
- These features make the child’s behavior unmanageable.
Childhood Autism Rating Scale (CARS) Test - Description and methodology of the test
Parents, caregivers, and clinicians who need a structured view of a child’s behavior can use the Childhood Autism Rating Scale (CARS) Test to organize observations across everyday situations. As a childhood autism assessment, it highlights patterns in communication, flexibility, social participation, and associated behaviors. The result helps identify areas for closer discussion and follow-up.
What This Assessment Explores
The questionnaire examines social communication, shared activity, understanding of social rules, speech development, flexibility, repetitive behavior, fears, sleep, aggression, and self-injury. These themes cover core autistic features and associated behaviors that can affect adaptation at home, school, or in groups.
It is intended for an adult who knows the child well enough to compare behavior across situations. As an autism rating scale, it can show whether concerns cluster around interaction, communication, rigidity, regulation, or safety, while also revealing uneven patterns, such as marked difficulty with change alongside milder dialogue concerns. The result describes observed characteristics; it does not by itself explain their cause, developmental context, or the child’s specific future needs.
Methodology and Evidence Base
Responses use ordered descriptions from 1 to 4, with half-point choices; higher descriptions indicate greater frequency, persistence, interference, or intensity. The profile reports total and domain results. The CARS questionnaire is conceptually consistent with Childhood Autism Rating Scale (CARS), its 1980 study and 1988 manual; Magyar and Pandolfi’s 2007 factor study examined its structure. This online 10-item presentation is not independently standardized against the full instrument, so interpret scores with developmental history and direct observation rather than as a diagnosis.
The displayed scales and ranges are:
- Communication Impairments, Impairments in Dialogue, Speech Structure and Development Impairments, Impairments in Understanding Social Rules and Roles, and Impairments in Cooperative Activity each use 1-4 and describe communication, language, social understanding, and cooperation.
- Adaptation to Change, Presence of Stereotyped Behaviors, Presence of Fears, Sleep Disturbances, and Aggression And Self-Injury each use 1-4 and describe flexibility, repetitive patterns, regulation, and safety concerns.
- Childhood Autism Rating Scale Total Score uses 10-40: Minimal-Mild traits 10-20.5, Moderate traits 20.5-28.5, and Severe-Profound traits 28.5-40.
- Schopler E, Reichler RJ, DeVellis RF, Daly K. Toward objective classification of childhood autism: Childhood Autism Rating Scale (CARS). Journal of Autism and Developmental Disorders. 1980;10(1):91-103. 10.1007/BF02408436
- Schopler E, Reichler RJ, Renner BR. The Childhood Autism Rating Scale (CARS). Los Angeles, CA: Western Psychological Services; 1988.
- Magyar CI, Pandolfi V. Factor structure evaluation of the Childhood Autism Rating Scale. Journal of Autism and Developmental Disorders. 2007;37(9):1787-1794. 10.1007/s10803-006-0313-9
Updated: