
Conspicuous Consumption Tendency Scale Test
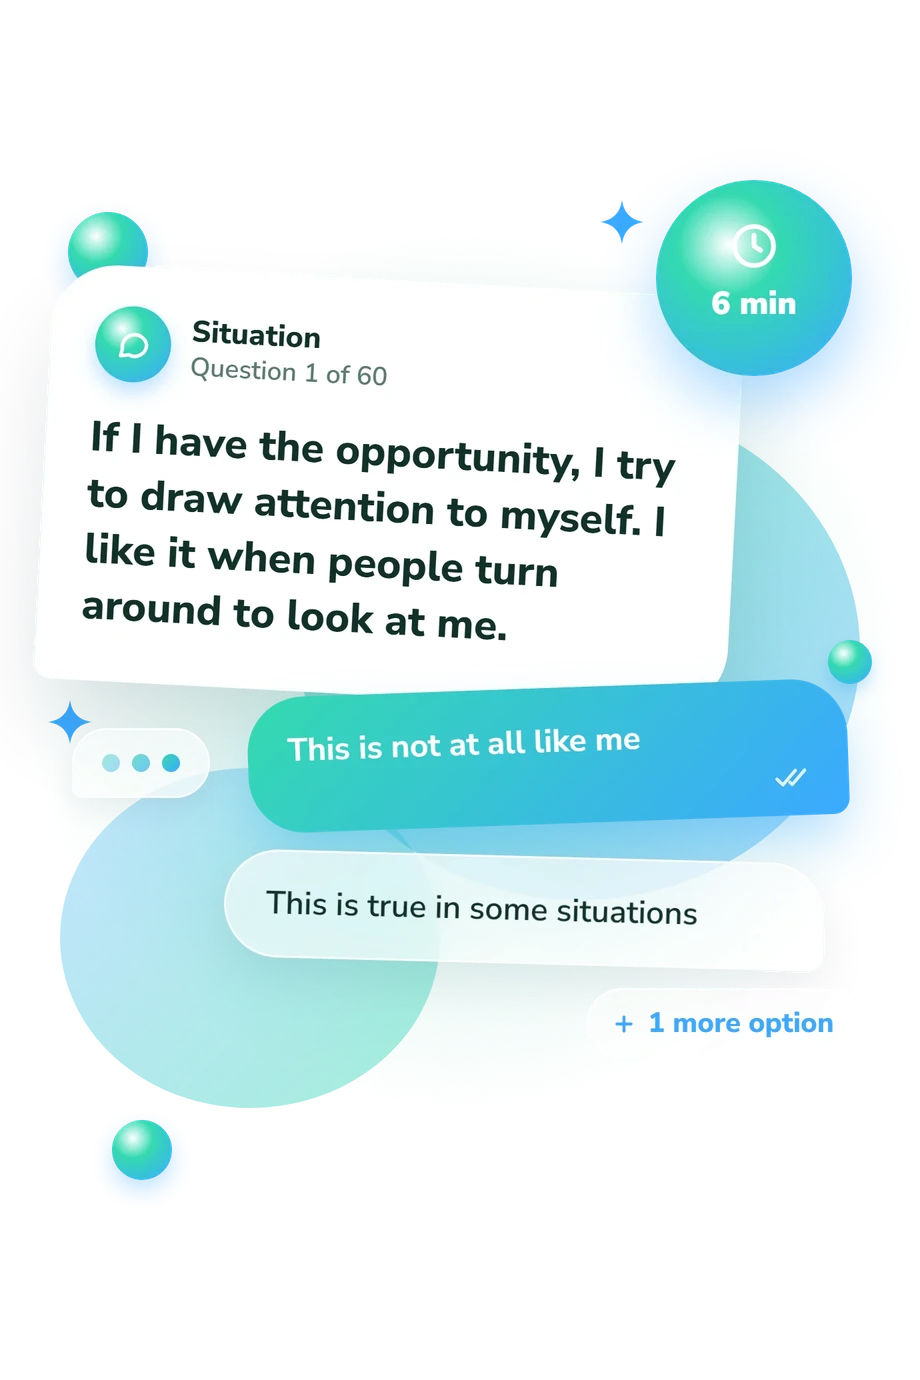
How the Scales are Structured
Who Usually Takes This Test?
See How You Compare
Below is a preview of how scores are typically distributed across each scale.
Example Questions From the Test
- This is not at all characteristic of me
- In some situations, this is true
- Yes, this describes me exactly
- Not at all like me
- Sometimes true
- Completely true of me
- This is not like me at all
- In some cases this is true
- Yes, this describes me exactly
Conspicuous Consumption Tendency Scale Test - Description and methodology of the test
For people who want to examine how appearance, possessions, and public presentation shape social impressions, the Conspicuous Consumption Tendency Scale Test offers a structured account of conspicuousness in consumption. Its conspicuous consumption profile is useful when considering personal style and social presentation. Pattern scores accompany an overall degree of demonstrativeness, so the result describes styles without treating motives as the sole construct.
What This Assessment Explores
The questionnaire examines conspicuous consumption dimensions through pattern scores and facets.
Nine pattern scales use Low 0-1, Moderate 2-3, and High 4-5:
- Release (0-6; Low 0-2, Moderate 3-4, High 5-6) reflects pleasure in unique or luxury items attracting attention.
- Perfectionism (0-5) reflects best-only standards; Escape From Poverty (0-5) reflects displaying prosperity to avoid poverty associations.
- Self-Affirmation (0-5) reflects noticeable items compensating for insecurity or avoiding negative evaluation; Fashion (0-5) reflects current trends.
- Prestige (0-5) reflects expensive status goods; Status Signaling (0-5) reflects goods signalling success or group membership.
- Creativity (0-5) reflects original self-expression; Individuality (0-5) reflects unusual, distinctive choices.
- Histrionic Traits (0-5) reflects extravagant attention-seeking; Conspicuousness in Consumption (0-60; Low demonstrativeness 0-19, Moderate demonstrativeness 20-40, Excessive demonstrativeness 41-60) summarizes demonstrativeness.
Methodology and Evidence Base
Each item offers three levels of self-description, from not characteristic to describing the respondent exactly. Statements cover appearance, shopping, brands, fashion, public settings, creativity, and reactions to attention, so the format records how strongly each statement fits rather than agreement or a yes-or-no choice.
In scoring, the conspicuous consumption questionnaire organizes responses into facet and overall scores. Each total is read against its displayed category, while the overall score summarizes demonstrativeness. These are questionnaire-specific bands, not clinical norms.
Conceptually, the questionnaire is consistent with Posypanova (2013), particularly the distinction between motives and forms of conspicuous consumption, and with Posypanova (2012). It also aligns with O’Cass and McEwen (2004), which treats status and conspicuous display as socially meaningful consumer behavior. The questionnaire is not an adaptation of either published instrument, and no standardization is documented.
Because answers are self-reported, current finances, mood, social setting, memory, and the wish to appear favorable can influence them. The profile is best read alongside actual behavior and personal circumstances rather than as a diagnosis.
- Posypanova, Olga Sergeevna. (2013). Features of Motivation of Conspicuous Consumption among Provincial Youth. Social Psychology and Society, 4(3), 116-129.
- Posypanova, Olga Sergeevna. (2012). Economic Psychology: Psychological Aspects of Consumer Behavior. Monograph. Kaluga: Publishing House of Kaluga State University named after K. E. Tsiolkovsky, 296 pp. Appendix 2, pp. 282-284.
- O’Cass, Aron, and Hmily McEwen. (2004). Exploring Consumer Status and Conspicuous Consumption. Journal of Consumer Behaviour, 4(1), 25-39. 10.1002/cb.155.
Updated: