
Hardiness Scale Test
How the Scales are Structured
Who Usually Takes This Test?
See How You Compare
Below is a preview of how scores are typically distributed across each scale.
Example Questions From the Test
- No
- Rather no
- Rather yes
- Yes
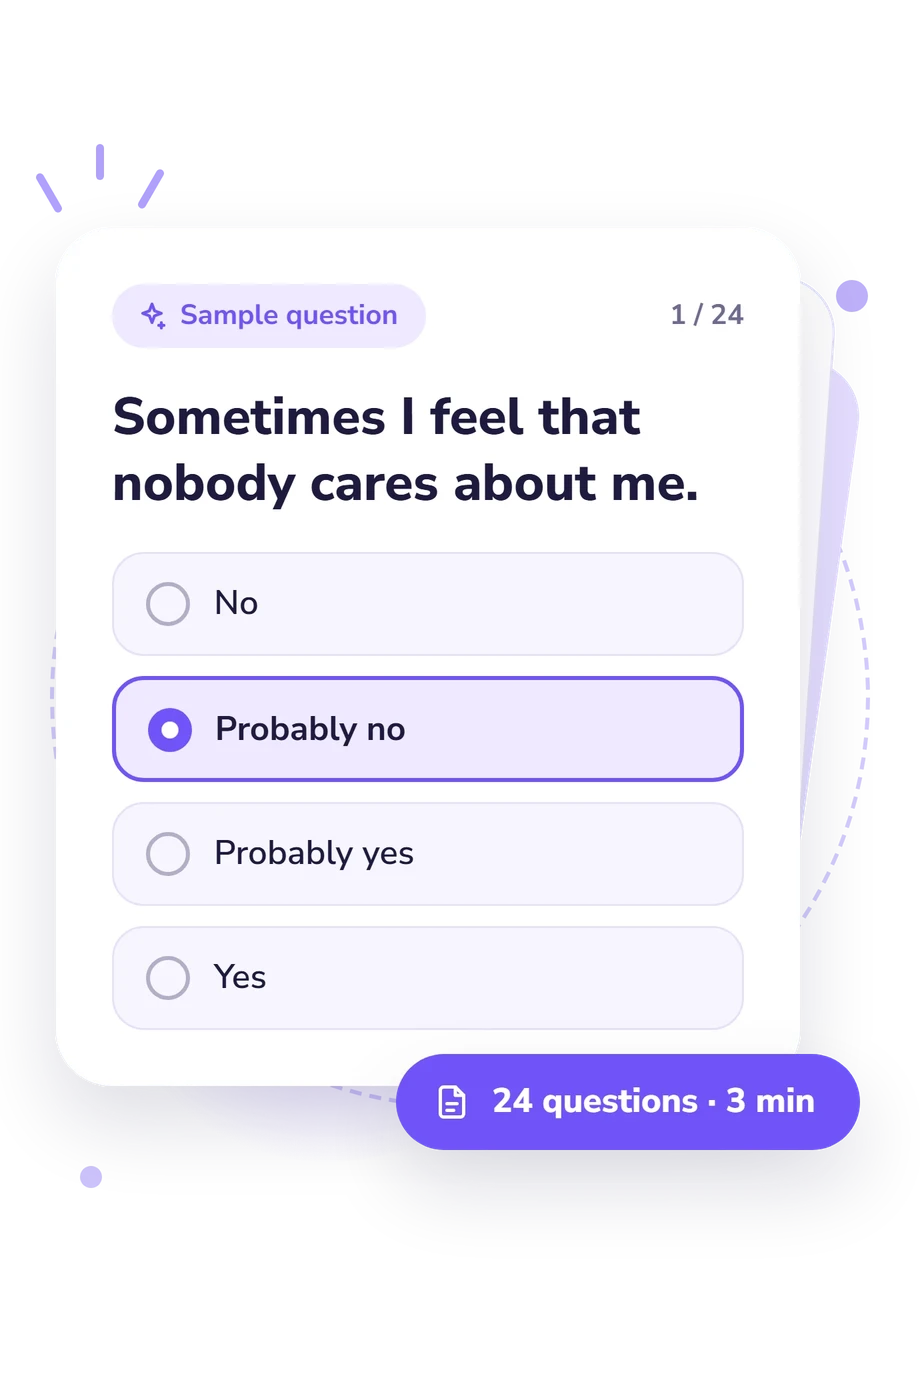
- No
- Probably no
- Probably yes
- Yes
- No
- Probably no
- Probably yes
- Yes
Hardiness Scale Test - Description and methodology of the test
People who want to understand their responses to pressure, setbacks, and uncertainty can use this assessment as a structured self-reflection tool. The Hardiness Scale Test is suited to readers examining whether they remain engaged, feel able to influence events, and treat change as manageable. This hardiness questionnaire maps coping-related beliefs into a connected profile rather than assigning a single personality label.
What This Assessment Measures
Items address involvement, agency, openness to change, growth, and difficulty. They include alienation, helplessness, fear about the future, and confidence in plans. Together, this hardiness assessment indicates whether events invite learning, uncertainty feels manageable, and engagement endures; coping and resilience are associated with higher overall hardiness.
These four displayed scales or areas are:
- Challenge (0-12) measures viewing events as opportunities for development and learning; Low 0-4, Moderate 5-8, High 9-12.
- Control (0-12) reflects belief in influencing events and choosing one's course; Low control 0-4, Moderate control 5-8, High control 9-12.
- Commitment (0-12) measures involvement in events and finding meaning in them; Low 0-4, Moderate 5-8, High 9-12.
- Hardiness (0-36) describes beliefs about oneself, the world, and one's relationship with it, involving commitment, control, and acceptance of risk; higher levels relate to effective coping, reduced tension, and resilience; Low 0-14, Moderate 15-24, High 25-36.
Methodology and Evidence Base
Each statement uses a four-point response format, ranging from No or Probably not/Rather no to Yes or Probably yes/Rather yes. Responses are converted into component and total scores, but the online form does not document the point assignment for each answer; therefore, the displayed bands should not be used to infer an unstated weighting rule.
Methodologically, the closest reference is the 12-item Hardiness Test (Osin, 2013). This questionnaire is conceptually consistent with that work and with the Hardiness Test associated with Leontiev and Rasskazova, while Maddi's commitment-control-challenge model provides a conceptual basis for comparison, not validation of this online questionnaire. It is not an adaptation of those publications, and the online form has no documented standardization or norms; findings about reliability or validity from them should not be transferred to it.
For interpretation, the hardiness score is best read as a profile: higher scores indicate more of the tendency defined by each scale, while the total reflects the broader construct. Current stress, self-perception, and candor can affect self-report results, so the result supports reflection rather than a clinical conclusion.
- Osin, E. N. (2013). Factor structure of the short version of the Test of Hardiness. Organizational Psychology, 3(3), 42-60. (In Russian).
- Osin, E. N., & Rasskazova, E. I. (2013). A short version of the Hardiness Test: Psychometric properties and organizational application. Lomonosov Psychology Journal, 2, 147-165. (In Russian).
- Leontiev, D. A., & Rasskazova, E. I. (2006). Hardiness Test. Moscow: Smysl. 63 pp. (In Russian).
- Maddi, S. R., Khoshaba, D. M., Persico, M., Lu, J. L., Harvey, R., & Bleecker, F. (2002). The Personality Construct of Hardiness: II. Relationships with Comprehensive Tests of Personality and Psychopathology. Journal of Research in Personality, 36(1), 72-85. 10.1006/jrpe.2001.2337
Updated: