
Chronic Fatigue Severity Scale Test
How the Scales are Structured
Who Usually Takes This Test?
See How You Compare
Below is a preview of how scores are typically distributed across each scale.
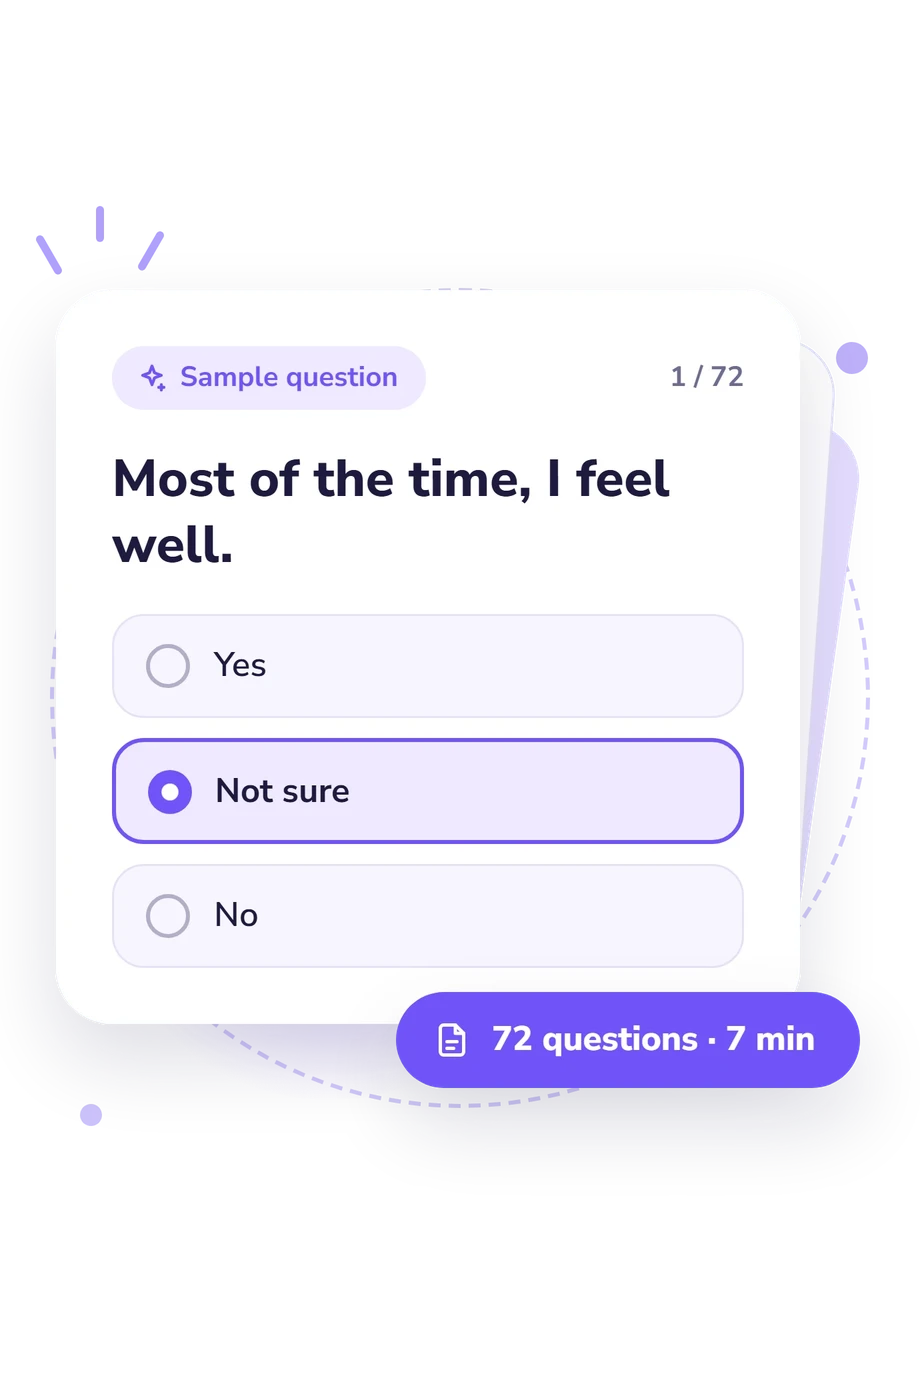
Example Questions From the Test
- Yes
- Not sure
- No
- Yes
- Not sure
- No
- Yes
- Not sure
- No
Chronic Fatigue Severity Scale Test - Description and methodology of the test
People who notice persistent tiredness, poorer concentration, physical discomfort, or changes in mood and relationships may use the Chronic Fatigue Severity Scale Test to organize these experiences into a profile. It is intended for readers seeking self-reflection when fatigue affects work, recovery, or everyday engagement. The profile produced by this chronic fatigue assessment shows which areas appear most affected and where preventive attention may be worthwhile.
What This Assessment Explores
The questionnaire examines chronic fatigue symptoms across bodily, cognitive, emotional, motivational, social, and work-capacity changes. It suits readers seeking a structured view of fatigue in everyday functioning.
Its dimensions are:
- Scale 1 (0-30) reflects physiological discomfort and possible somatic expression of fatigue: Low 0-10; Moderate 11-20; High 21-30.
- Scale 2 (0-20) reflects reduced overall well-being and cognitive discomfort affecting mental functioning: Low impact 0-6; Moderate 7-13; High 14-20.
- Scale 3 (0-12) reflects emotional and affective disturbance through changes in mood and emotional stability: Low 0-4; Moderate 5-8; High 9-12.
- Scale 4 (0-10) reflects reduced motivation and changes in social interaction, potentially signaling worsening fatigue: Low impact 0-3; Moderate impact 4-6; High impact 7-10.
- Chronic Fatigue Index (0-72) reflects accumulated fatigue and its impact on work capacity, helping flag fatigue-related impairment: Low / none 0-16; Developing 17-37; Severe / very high 38-72.
Methodology and Evidence Base
Items ask about recurring experiences such as tiredness after sleep, daytime sleepiness, irritability, low mood, memory difficulty, pain, visual strain, palpitations, breathlessness, and reduced enjoyment of work. In the sampled items, statements offer Yes, Not sure, or No, allowing the respondent to indicate whether the experience fits. Responses are grouped into domain scores and a composite index; the questionnaire does not specify each answer’s point value.
Its approach is consistent with the functional-state psychodiagnostic tradition described by Leonova. The questionnaire is conceptually consistent with that framework, not an adaptation of a published instrument. Leonova’s framework connects subjective symptoms with regulation, performance, and everyday behavior. Together, these domains show how fatigue can affect bodily comfort, thinking, mood, motivation, relationships, and work capacity.
For interpretation, read the categories together rather than treating one elevated area as decisive. The displayed result from this fatigue severity assessment can be affected by sleep, illness, stress, workload, and self-report accuracy. The displayed bands are questionnaire-specific categories, not established population norms, and scores do not establish a clinical diagnosis.
- Leonova, Anna B., and Kuznetsova, Alla S. Psychological Technologies for Managing Human States. Moscow: Smysl, 2007. 311 pp. ISBN 978-5-89357-241-4.
- Leonova, Anna B. Psychodiagnostics of Human Functional States. Moscow: Moscow University Press, 1984. 200 pp.
- Glazachev, O.S., Dudnik, E.N., and Zagaynaya, E.E. Pharmacological Treatment of Patients with Chronic Fatigue Syndrome. S.S. Korsakov Journal of Neurology and Psychiatry, 2017, 117(4), 40-44. 10.17116/jnevro20171174140-44
Updated: