
Sociotropy-Self-Sufficiency Scale Test
How the Scales are Structured
Who Usually Takes This Test?
See How You Compare
Below is a preview of how scores are typically distributed across each scale.
Example Questions From the Test
- Never
- Rarely
- Sometimes
- Often
- Always
- Never
- Rarely
- Sometimes
- Often
- Always
- Never
- Rarely
- Sometimes
- Often
- Always
Sociotropy-Self-Sufficiency Scale Test - Description and methodology of the test
For people reviewing recurring interpersonal choices and wanting a structured view of their tendencies, the Sociotropy-Self-Sufficiency Scale Test offers a profile rather than a single personality label. This sociotropy self-sufficiency assessment organizes responses into dimensions that can highlight habitual ways of navigating relationships and personal decisions. It is useful for guided self-reflection about patterns that may be easy to overlook.
What This Assessment Explores
This self-sufficiency questionnaire profiles tendencies across social situations rather than defining a fixed character type. It covers five indicators:
- Self-Sufficiency (12-60) measures independence in relation to society through personal beliefs, goals, and opinions rather than others’ opinions; Low 12-27, Moderate 28-44, High 45-60.
- Attachment (10-50) measures the need for interpersonal connection and seeking approval, warmth, and support; Low 10-23, Moderate 24-36, High 37-50.
- Dependence (7-35) measures how strongly others’ opinions guide social interaction; Low reliance 7-15, Moderate reliance 16-25, High reliance 26-35.
- Social Insecurity (10-50) measures confidence in appraising social interactions, using adequate strategies, and interpreting feedback accurately; Low 10-23, Moderate 24-36, High 37-50.
- Total Score (39-195) measures overall sociotropy and self-sufficiency: higher scores indicate stronger social orientation, while lower scores indicate greater independence and self-sufficiency; More independent 39-90, Balanced 91-143, More relationship-oriented 144-195.
Methodology and Evidence Base
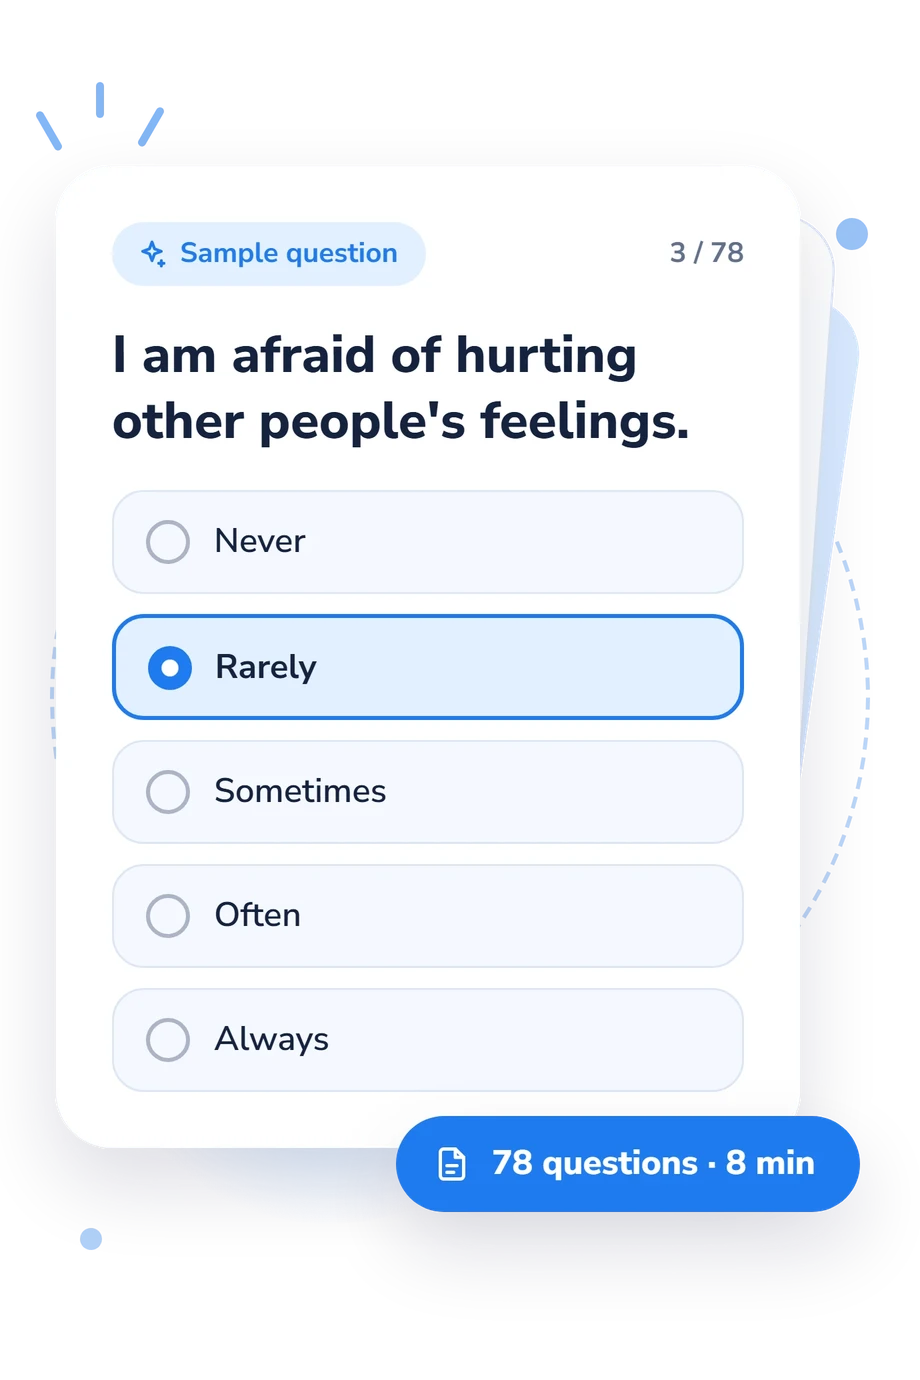
The sampled statements use a five-point format from Never to Always. The items sample approval, rejection, closeness, responsibility, autonomy, opinion expression, and confidence in social feedback. Responses combine into four displayed subscales and an overall result; the online format does not state a point-by-point weighting rule.
As a sociotropy test, the questionnaire is conceptually consistent with the Sociotropy-Autonomy Scale (SAS; Beck et al., 1983), which contrasts relationship-oriented needs with self-directed functioning. This online version is not the original SAS and should not be assumed to share its exact items or psychometric properties. Later studies by Clark and Beck (1991), Clark et al. (1995), and Bieling et al. (2000) provide refinement and structural context.
Interpretation is strongest when the pattern across dimensions is considered alongside the situations that prompted each answer. The online version does not document a standardization sample, norms, reliability estimates, or validity results, and self-report ratings may shift with current mood, relationships, self-awareness, and candour, so the bands are descriptive rather than norm-referenced and the profile is best read as structured reflection rather than a clinical conclusion.
- Beck, A. T., Epstein, N., Harrison, R. P., & Emery, G. (1983). Development of the Sociotropy-Autonomy Scale: A measure of personality factors in psychopathology. Unpublished manuscript, Center for Cognitive Therapy, University of Pennsylvania Medical School, Philadelphia.
- Clark, D. A., & Beck, A. T. (1991). Personality factors in dysphoria: A psychometric refinement of Beck's Sociotropy-Autonomy Scale. Journal of Psychopathology and Behavioral Assessment, 13(4), 369-388. 10.1007/BF00960448
- Clark, D. A., Steer, R. A., Beck, A. T., & Ross, L. (1995). Psychometric characteristics of revised Sociotropy and Autonomy Scales in college students. Behaviour Research and Therapy, 33(3), 325-334. 10.1016/0005-7967(94)00074-T
- Bieling, P. J., Beck, A. T., & Brown, G. K. (2000). The Sociotropy-Autonomy Scale: Structure and Implications. Cognitive Therapy and Research, 24(6), 763-780. 10.1023/A:1005599714224
Updated: