
Freudly+971 508685814hello@freudly.ai
Freudly
self-regulation

Children's Behavioral Self-Regulation Style Questionnaire Test
Take the online Children's Behavioral Self-Regulation Style Questionnaire Test - AI psychologist FreudlyYou can take Children's Behavioral Self-Regulation Style Questionnaire Testhere. Online version of a simple and accurate psychological test with interpretation.en
Understand how a child ages 6 to 16 manages attention, actions, and self-control in school and daily life in about 2 minutes. Get a quick, clear snapshot that pinpoints challenges and guides support strategies.
Start Online Test
Questions: 72 minutes
08:30
October 2, 2025
October 2, 2025
Material has been updated
October 2, 2025
Material has been published
32,564 views
2,963 completions
2,544 likes
Verified by Daniel Hall
Psychologist with 25 years of experience
Share
Scale Explorer

How the Scales are Structured

example score
4/6
Responsibility (R)
Measures how consistently a child consciously plans, follows through on duties, and keeps commitments.
Low
Moderate
High
13.9: Low | 44.9: Moderate | 56: High
A score of 4 suggests a moderate level of responsibility, with generally adequate follow-through and promise-keeping but occasional lapses in planning or execution.
example score
4/6
Independence (I)
Measures how independently a child can plan, carry out, and monitor their activities without relying on others’ guidance or opinions.
More reliant
Independent
Highly independent
13.9: More reliant | 44.9: Independent | 56: Highly independent
A score of 4 suggests the child is generally able to organize and monitor their activities independently, with occasional need for external input.
example score
4/6
Flexibility (F)
Measures how well a child can adjust actions and behavior when conditions or expectations change.
Low flexibility
Moderate flexibility
High flexibility
13: Low flexibility | 4: Moderate flexibility | 56: High flexibility
A score of 4 suggests generally adequate adjustment to change, with some situations still requiring extra time or support to shift strategies.
example score
3/6
Outcome Evaluation (OE)
Measures a child’s self-evaluation and ability to analyze and adjust their actions based on results.
Low
Moderate
High
13.9: Low | 44.9: Moderate | 56: High
A score of 3 suggests lower-than-average self-criticism and less stable criteria for judging success, which may make it harder to consistently adjust behavior after feedback.
example score
3/6
Planning (P)
Measures a child's ability to consciously plan, sequence, and adjust actions to reach goals.
Needs structure
Developing planning
Strong planning
13.9: Needs structure | 44.9: Developing planning | 56: Strong planning
A score of 3 suggests the child may have difficulty consistently planning and adjusting action sequences and may benefit from clear prompts and step-by-step structure.
example score
2/6
Modeling (M)
Measures how well a child identifies important conditions and forms clear goals and action plans to achieve them.
Low
Average
High
13.9: Low | 44.9: Average | 56: High
A score of 2 falls in the Low range, suggesting the child may have difficulty recognizing key conditions for success and outlining a clear plan toward goals.
example score
3/6
Planning (P)
Measures how well a child sets goals and consciously plans and follows through on actions.
Low planning
Adequate planning
High planning
13.9: Low planning | 44.9: Adequate planning | 56: High planning
A score of 3 suggests low planning, with goals and action plans tending to be situational and less consistent.
Start Online Test
just completed the test
DATA-BASED USER COHORTS

Who Usually Takes This Test?

School Psychologists
44%OF USERS
Use it to quickly profile a student’s self-control, attention regulation, and willpower to guide support plans and referrals.
Elementary and Middle Teachers
33%OF USERS
Take it to better understand classroom behavior patterns and choose practical strategies for helping students stay on task.
Parents Seeking Clarity
23%OF USERS
Use it to pinpoint where a child struggles with self-regulation at home and school and discuss targeted help with specialists.
BASED ON AGGREGATED, ANONYMIZED DATA FROM TENS OF THOUSANDS OF FREUDLY USERS.
Benchmarking

See How You Compare

Once you complete the test, your results are compared with real-world data from people in your country.
Below is a preview of how scores are typically distributed across each scale.
Responsibility (R)
Responsibility (R)
Average
2.4
Normal range
1.73
min.
1
max.
6
This curve shows how scores are typically distributed.
Once you complete the test, your result will appear on the scale so you can see how you compare.
Independence (I)
Independence (I)
Average
2.5
Normal range
1.83.3
min.
1
max.
6
This curve shows how scores are typically distributed.
Once you complete the test, your result will appear on the scale so you can see how you compare.
Flexibility (F)
Flexibility (F)
Average
2.9
Normal range
1.93.8
min.
1
max.
6
This curve shows how scores are typically distributed.
Once you complete the test, your result will appear on the scale so you can see how you compare.
Evaluation of Results (EoR)
Average
4.4
Normal range
3.65.2
min.
1
max.
6
This curve shows how scores are typically distributed.
Once you complete the test, your result will appear on the scale so you can see how you compare.
Programming (P)
Programming (P)
Average
2.7
Normal range
1.93.6
min.
1
max.
6
This curve shows how scores are typically distributed.
Once you complete the test, your result will appear on the scale so you can see how you compare.
Modeling (M)
Modeling (M)
Average
3
Normal range
2.14
min.
1
max.
6
This curve shows how scores are typically distributed.
Once you complete the test, your result will appear on the scale so you can see how you compare.
Planning (P)
Planning (P)
Average
2.3
Normal range
1.72.9
min.
1
max.
6
This curve shows how scores are typically distributed.
Once you complete the test, your result will appear on the scale so you can see how you compare.
Featured On
SAMPLE QUESTIONS

Example Questions From the Test

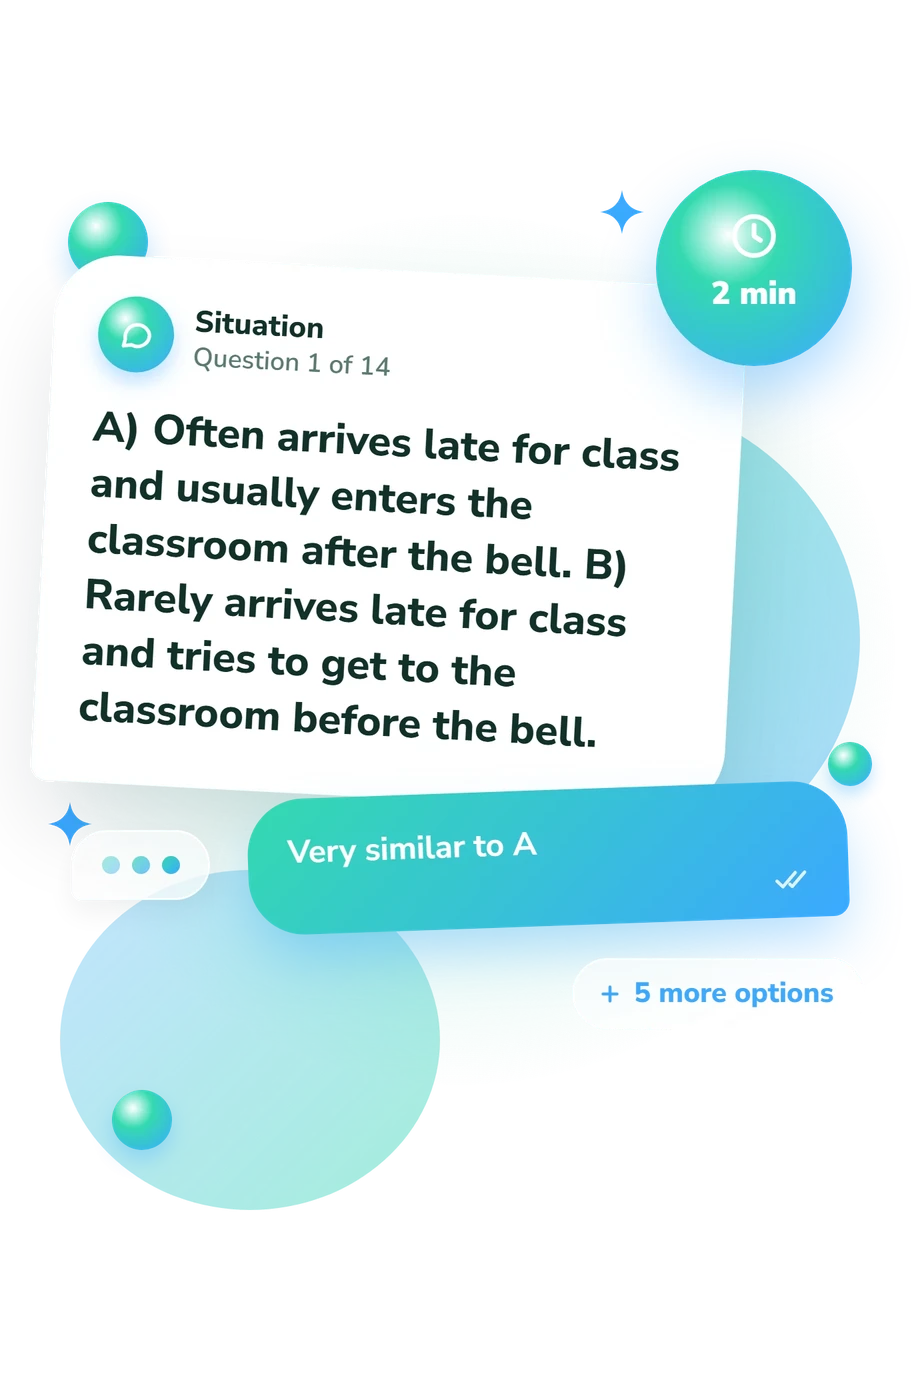
The examples describe two students with opposite personality characteristics and how they behave in different situations (at school, in class, at home, with friends). Select one of the two students—the one who is more similar to you—and indicate the degree of similarity. If most of the described characteristics apply to you, select the option “similar to X.”
    • Very much like A
    • Like A
    • A little like A
    • A little like B
    • Like B
    • Very much like B
    • Very similar to A
    • Similar to A
    • Somewhat similar to A
    • Somewhat similar to B
    • Similar to B
    • Very similar to B
    • Very much like A
    • Like A
    • Somewhat like A
    • Somewhat like B
    • Like B
    • Very much like B
WHAT THE TEST MEASURES
About This Assessment
Children's Behavior Self-Regulation Style, CBSS-M Test

Children's Behavioral Self-Regulation Style Questionnaire Test - Symptoms and Signs

self-regulation

This brief questionnaire is designed to support screening of children’s self-regulation in everyday learning and classroom contexts. The Children’s Behavioral Self-Regulation Style Questionnaire is intended to characterize how a child typically manages attention, behavior, and effortful control across common situations.

It consists of 7 items and typically takes about 2 minutes to complete. Items are phrased to be developmentally appropriate for school-age respondents and may be used as part of a broader psychological or educational assessment, with results interpreted alongside collateral information (e.g., teacher or caregiver observations).

The Children’s Behavioral Self-Regulation Style Questionnaire is attributed to Roy F. Baumeister and is best used to inform hypothesis generation and intervention planning rather than as a stand-alone diagnostic instrument.

Author: Roy F. Baumeister
Literature: Zimmerman, B. J. Becoming a self-regulated learner: An overview. Theory Into Practice. 2002.
Popular tests
Comments
Leave a Comment