
Psychological Safety of the Educational Environment Test
How the Scales are Structured
Who Usually Takes This Test?
See How You Compare
Below is a preview of how scores are typically distributed across each scale.
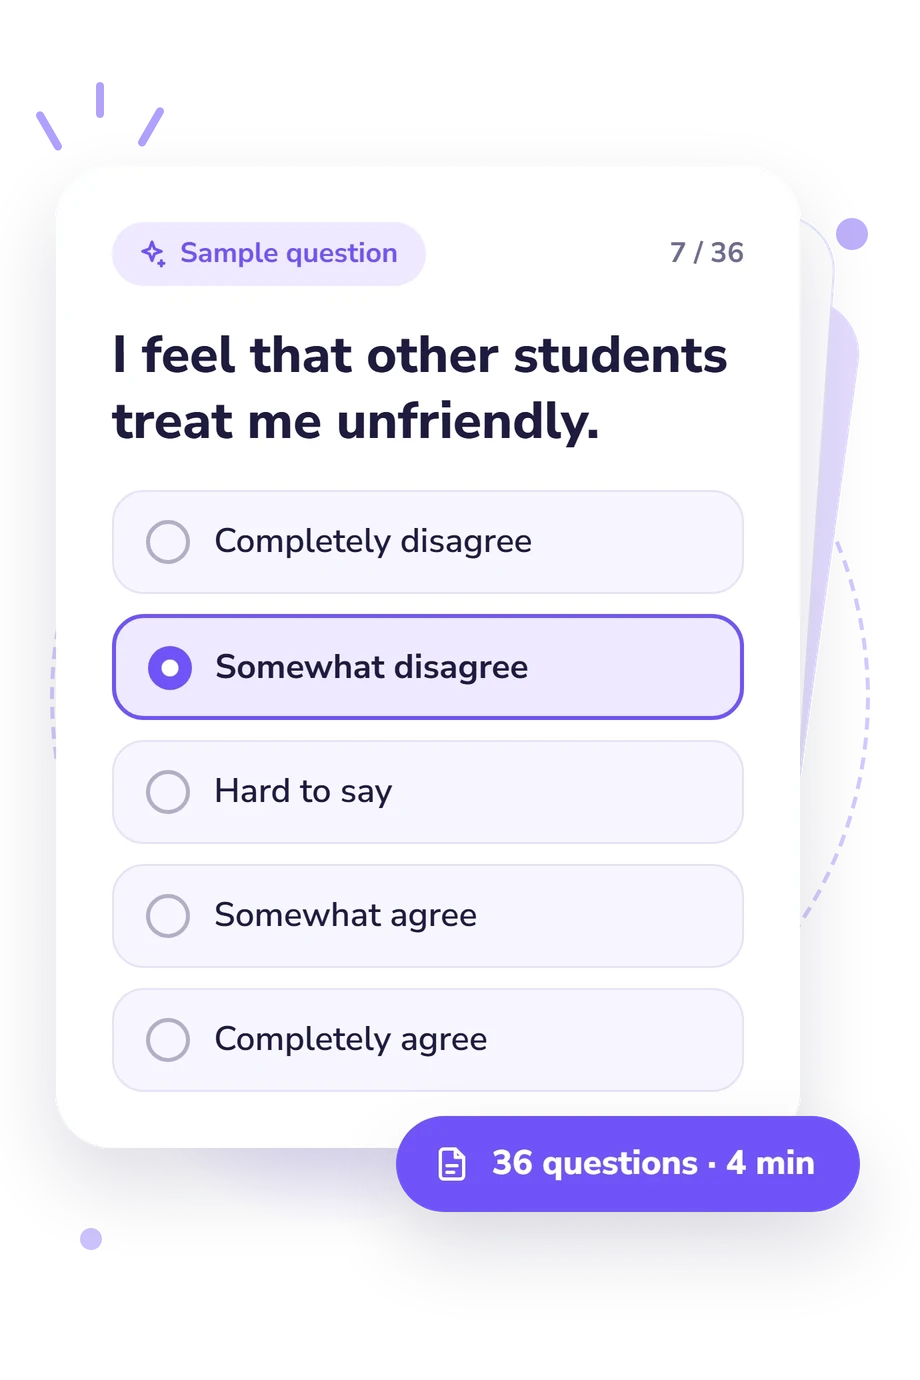
Example Questions From the Test
- Completely disagree
- Rather disagree
- Hard to say
- Rather agree
- Completely agree
- Strongly disagree
- Somewhat disagree
- Not sure
- Somewhat agree
- Strongly agree
- Completely disagree
- Rather disagree
- Hard to say
- Rather agree
- Completely agree
Psychological Safety of the Educational Environment Test - Description and methodology of the test
For anyone reflecting on their own school experience, the Psychological Safety of the Educational Environment Test offers a structured way to reflect on everyday interactions, dignity, trust, participation, and emotional well-being. The profile from this educational environment safety test can give the respondent and the adults around them a starting point for discussing relationships, support, and the wider climate. The profile separates general impressions from experiences involving peers and adults.
What This Assessment Explores
This self-report examines perceived school climate through comfort, satisfaction, expression, peer relations, adult support, and protection from harm.
The scales are:
- Psychological Satisfaction With the Educational Environment (0-24) measures satisfaction with conditions and climate plus positive attitudes toward the educational process and its organization: Low satisfaction (0-7), Moderate satisfaction (8-16), High satisfaction (17-24).
- Psychological Comfort (0-24) measures comfort, safety, and emotional well-being: Low comfort (0-7), Moderate comfort (8-16), High comfort (17-24).
- Students (0-12) measures psychological safety through interactions with other students and favorable peer climate: Low peer support (0-4), Mixed/variable climate (5-8), Positive peer climate (9-12).
- Adults (0-12) measures adult support and safety: Low adult protection (0-4), Moderate adult protection (5-8), High adult protection (9-12).
- Psychological Security (0-24) measures protection in adult-student interactions and discomfort risk: Low security (0-7), Moderate security (8-16), High security (17-24).
Methodology and Scientific Basis
Responses use five-position agreement scales, with a middle uncertainty option in several items. Statements cover humiliation, pressure, exclusion, trust, support, participation, and belonging. The results present reported scale scores alongside displayed bands; because the item-to-score rule is not specified, it should not be inferred from the ranges.
The framework treats psychological safety in schools as a relational experience involving peers, adults, and educational life. Its anchor is Psychological Safety of the School Educational Environment (Baeva, 2006), which connects safety with respectful treatment, supportive relationships, participation, and development. This questionnaire is conceptually consistent with that framework, not presented as a direct reproduction or validated adaptation.
Baeva and Bordovskaia (2015) link educational-environment safety with psychological well-being, while Baeva and Semikin (2005) connect safety with psychological culture and schoolchildren’s mental health. These studies provide related conceptual evidence and context, but do not establish reliability, validity, or norms for this online version.
Read the profile as structured self-report reflection. Current mood, recent incidents, memory, social desirability, and willingness to disclose can shape answers; the bands are not population norms or clinical cutoffs.
- Baeva, I.A. (2006). Psychological Safety of the Educational Environment of the School. In I.A. Baeva (Ed.), Providing Psychological Security in an Educational Institution: A Practical Guide (pp. 105-118). Saint Petersburg: Rech.
- Baeva, I.A., & Bordovskaia, N.V. (2015). The Psychological Safety of the Educational Environment and the Psychological Well-Being of Russian Secondary School Pupils and Teachers. Psychology in Russia: State of Art, 8(1), 86-99. 10.11621/pir.2015.0108
- Baeva, I.A., & Semikin, V.V. (2005). Safety of the Educational Environment, Psychological Culture and Mental Health of Schoolchildren. Izvestia: Herzen University Journal of Humanities & Sciences, 5(12), 7-19.
Updated: