
Freudly+971 508685814hello@freudly.ai
Freudly
depression

Depression Symptom and Severity Questionnaire Test
Take the online Depression Symptom and Severity Questionnaire Test - AI psychologist FreudlyYou can take Depression Symptom and Severity Questionnaire Testhere. Online version of a simple and accurate psychological test with interpretation.en
Understand depression symptoms and severity in about 14 minutes. ICD-10 aligned results map symptom patterns and depth to guide care plans and track progress over time.
Start Online Test
Questions: 7214 minutes
08:30
October 2, 2025
October 2, 2025
Material has been updated
October 2, 2025
Material has been published
32,126 views
6,445 completions
2,743 likes
Verified by Daniel Hall
Psychologist with 25 years of experience
Share
Scale Explorer

How the Scales are Structured

example score
1/6
Depressed Mood (DM)
Assesses the intensity of lowered mood as a core depressive symptom, with higher scores indicating more pronounced low mood.
Minimal
Significant
04: Minimal | 56: Significant
A score of 1 falls in the Minimal range, indicating low mood is currently reported at a low level on this scale.
example score
4/6
Bleak View of the Future (BVotF)
Measures the degree of pessimistic, gloomy expectations about the future as a depressive symptom indicator.
Low
Moderate
Significant
03: Low | 4: Moderate | 56: Significant
A score of 4 indicates a moderate gloomy outlook on the future, below the level typically considered clinically significant on this scale.
example score
3/6
Defensiveness/Dissimulation (D)
Measures the tendency to underreport, minimize, or conceal depressive symptoms, which can affect the interpretability of results.
Low dissimulation
Elevated dissimulation
03: Low dissimulation | 46: Elevated dissimulation
A score of 3 falls in the Low dissimulation range, suggesting little indication of deliberate underreporting on this validity scale.
example score
3/6
Symptom Exaggeration/Malingering (SE)
Assesses the tendency to exaggerate or simulate depressive symptoms, which can affect the reliability of the questionnaire results.
Typical responding
Elevated exaggeration risk
High simulation risk
03: Typical responding | 4: Elevated exaggeration risk | 56: High simulation risk
A score of 3 falls in the Typical responding range, suggesting no notable tendency to exaggerate symptoms on this control scale.
example score
4/6
Decreased Appetite (DA)
Assesses the extent of reduced appetite as a depressive symptom.
None to mild
Clinically significant
04: None to mild | 56: Clinically significant
A score of 4 indicates none to mild reduced appetite and falls below the level considered significant on this scale.
example score
3/6
Sleep Disturbance (SD)
Measures the severity of sleep disruption that may accompany depressive symptoms.
None to mild
Significant
04: None to mild | 56: Significant
A score of 3 falls in the none-to-mild range, suggesting limited sleep disturbance on this scale.
example score
2/6
Self-Harm Ideation (SHI)
Assesses the presence and intensity of thoughts or behaviors related to self-harm or suicide as an additional symptom of depression.
None/Low
Clinically significant
04: None/Low | 56: Clinically significant
A score of 2 falls in the None/Low range, suggesting little to no endorsement of self-harm or suicidal thoughts/behaviors on this scale.
example score
3/6
Guilt Ideation (GI)
Measures the intensity of guilt and self-deprecating thoughts as a depressive symptom dimension.
Low
Moderate
High
03: Low | 4: Moderate | 56: High
A score of 3 falls in the Low range, suggesting guilt-related and self-deprecating thoughts are present at a low intensity.
example score
3/6
Low Self-Esteem (LSE)
Measures reduced self-esteem and confidence that can accompany depressive states.
Within typical range
Clinically significant
04: Within typical range | 56: Clinically significant
A score of 3 falls within the typical range, suggesting low self-esteem is not prominent on this scale.
example score
3/6
Reduced Attention (RA)
Measures reductions in the ability to concentrate and sustain attention as a depressive-associated symptom.
None/minimal
Symptom present
04: None/minimal | 56: Symptom present
A score of 3 falls in the none/minimal range, suggesting no notable reduction in attention on this scale.
example score
1/6
Decreased Energy (DE)
Assesses the extent of reduced energy and increased fatigue associated with depressive symptoms.
Low/none
Significant
04: Low/none | 56: Significant
A score of 1 falls in the Low/none range, suggesting minimal reported fatigue or energy reduction on this scale.
example score
3/6
Loss of Interest (LoI)
Measures the degree of reduced interest and diminished capacity to experience pleasure associated with depressive states.
Low
Elevated
03: Low | 46: Elevated
A score of 3 suggests a low level of loss of interests, with some reduction in enjoyment or engagement but not pronounced.
Start Online Test
just completed the test
DATA-BASED USER COHORTS

Who Usually Takes This Test?

Clients in therapy
44%OF USERS
People already seeing a psychologist or psychotherapist take it to clarify their current symptoms and track change over sessions.
People with persistent low mood
33%OF USERS
Individuals who suspect depression use it to identify which symptoms they have and how severe they feel.
Clinicians screening new referrals
23%OF USERS
Mental health professionals use it at intake to quickly map symptom patterns and decide on an initial treatment plan.
BASED ON AGGREGATED, ANONYMIZED DATA FROM TENS OF THOUSANDS OF FREUDLY USERS.
Benchmarking

See How You Compare

Once you complete the test, your results are compared with real-world data from people in your country.
Below is a preview of how scores are typically distributed across each scale.
Low mood (Lm)
Low mood (Lm)
Average
4.2
Normal range
3.15.2
min.
0
max.
6
This curve shows how scores are typically distributed.
Once you complete the test, your result will appear on the scale so you can see how you compare.
A Gloomy Vision of the Future (AGVotF)
Average
2.7
Normal range
1.83.7
min.
0
max.
6
This curve shows how scores are typically distributed.
Once you complete the test, your result will appear on the scale so you can see how you compare.
Secrecy/Dissimulation (S)
Average
2.5
Normal range
1.63.5
min.
0
max.
6
This curve shows how scores are typically distributed.
Once you complete the test, your result will appear on the scale so you can see how you compare.
Aggravation/Simulation (A)
Average
2.4
Normal range
1.33.4
min.
0
max.
6
This curve shows how scores are typically distributed.
Once you complete the test, your result will appear on the scale so you can see how you compare.
Reduced appetite (Ra)
Average
2
Normal range
0.93
min.
0
max.
6
This curve shows how scores are typically distributed.
Once you complete the test, your result will appear on the scale so you can see how you compare.
Disrupted Sleep (DS)
Average
1.9
Normal range
1.12.6
min.
0
max.
6
This curve shows how scores are typically distributed.
Once you complete the test, your result will appear on the scale so you can see how you compare.
Self-harm ideas (Si)
Average
4.3
Normal range
3.25.3
min.
0
max.
6
This curve shows how scores are typically distributed.
Once you complete the test, your result will appear on the scale so you can see how you compare.
Ideas of Guilt (IoG)
Average
2.7
Normal range
1.93.5
min.
0
max.
6
This curve shows how scores are typically distributed.
Once you complete the test, your result will appear on the scale so you can see how you compare.
Low Self-Esteem (LS)
Average
2.3
Normal range
1.33.2
min.
0
max.
6
This curve shows how scores are typically distributed.
Once you complete the test, your result will appear on the scale so you can see how you compare.
Reduced attention (Ra)
Average
2.8
Normal range
1.83.8
min.
0
max.
6
This curve shows how scores are typically distributed.
Once you complete the test, your result will appear on the scale so you can see how you compare.
Reduced Energy Levels (REL)
Average
4.5
Normal range
3.55.5
min.
0
max.
6
This curve shows how scores are typically distributed.
Once you complete the test, your result will appear on the scale so you can see how you compare.
Loss of Interests (LoI)
Average
3.5
Normal range
2.74.3
min.
0
max.
6
This curve shows how scores are typically distributed.
Once you complete the test, your result will appear on the scale so you can see how you compare.
Featured On
SAMPLE QUESTIONS

Example Questions From the Test

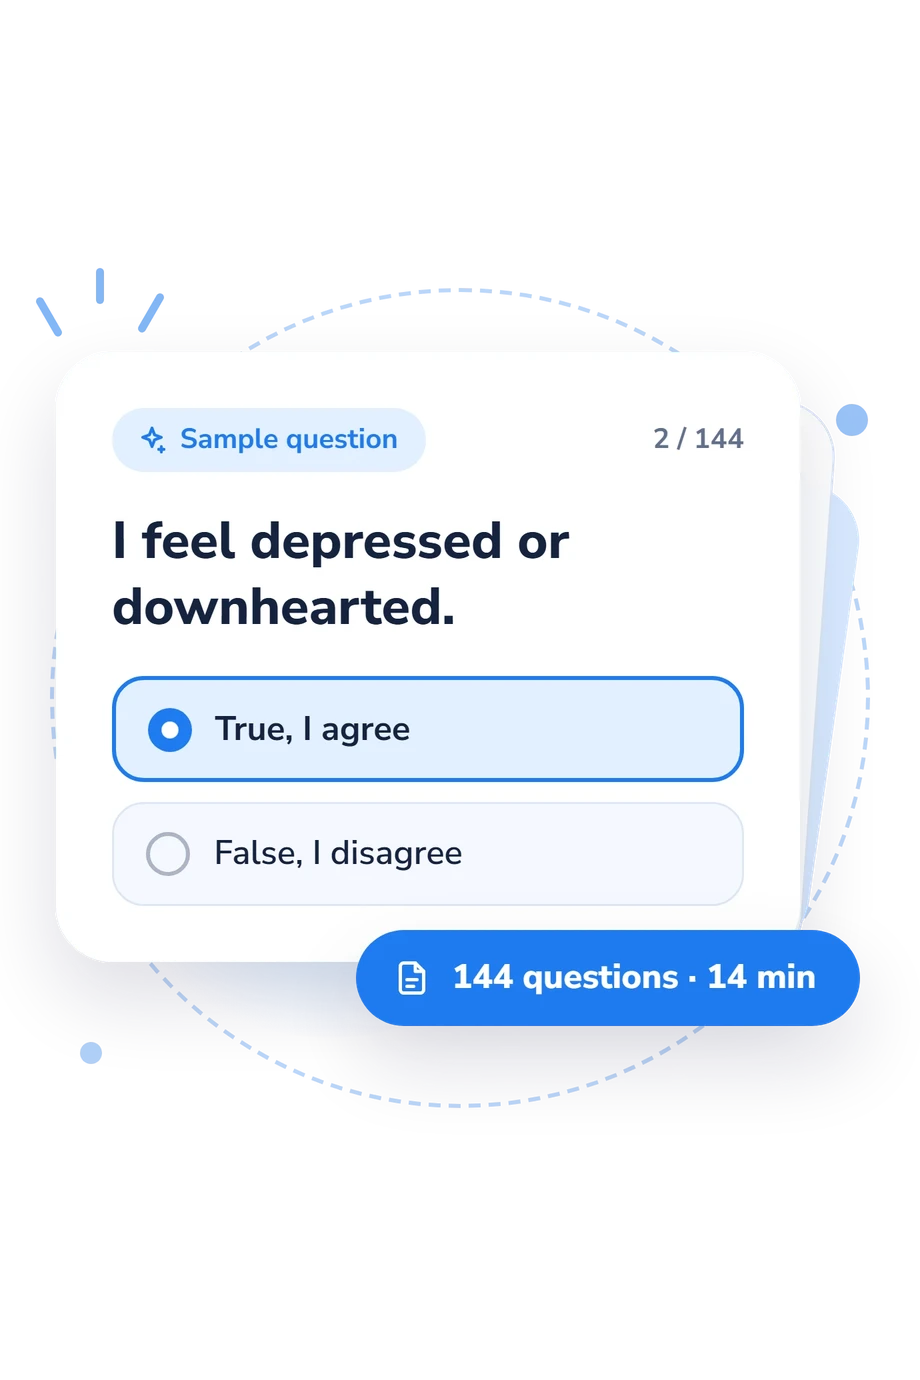
Please read the statements below carefully and rate the extent to which they reflect your recent condition. Respond as quickly as possible, without spending too much time thinking. If you find it difficult to clearly agree or disagree with a statement, select the response option you are more inclined toward. Please answer as honestly and candidly as possible, as this will help to better understand your difficulties and, if necessary, provide appropriate professional assistance.
    • True, I agree
    • False, I disagree
    • True; I agree
    • Not true; I disagree
    • True
    • False
WHAT THE TEST MEASURES
About This Assessment
Symptoms and Severity of Depression Questionnaire, SSDQ Test

Depression Symptom and Severity Questionnaire Test - Symptoms and Signs

depression

This measure is designed to support structured evaluation of depressive symptoms and their severity. The Depression Symptom and Severity Questionnaire is intended to help characterize the presence and relative intensity of common depressive features for clinical documentation and treatment planning. It is attributed to Aaron T. Beck.

The questionnaire consists of 72 items and typically requires about 14 minutes to complete. Results are generally interpreted as a symptom profile and severity estimate rather than as a standalone diagnostic determination, and may be used for baseline assessment and follow-up monitoring. In practice, the Depression Symptom and Severity Questionnaire can be administered alongside clinical interview and other assessment data to inform case formulation and track change over time.

Author: Aaron T. Beck
Literature: Beck, A. T., Steer, R. A., & Brown, G. K. Manual for the Beck Depression Inventory-II. Psychological Corporation. 1996.
Popular tests
Comments
Leave a Comment