
School Subjective Well-Being Questionnaire Test
How the Scales are Structured
Who Usually Takes This Test?
See How You Compare
Below is a preview of how scores are typically distributed across each scale.
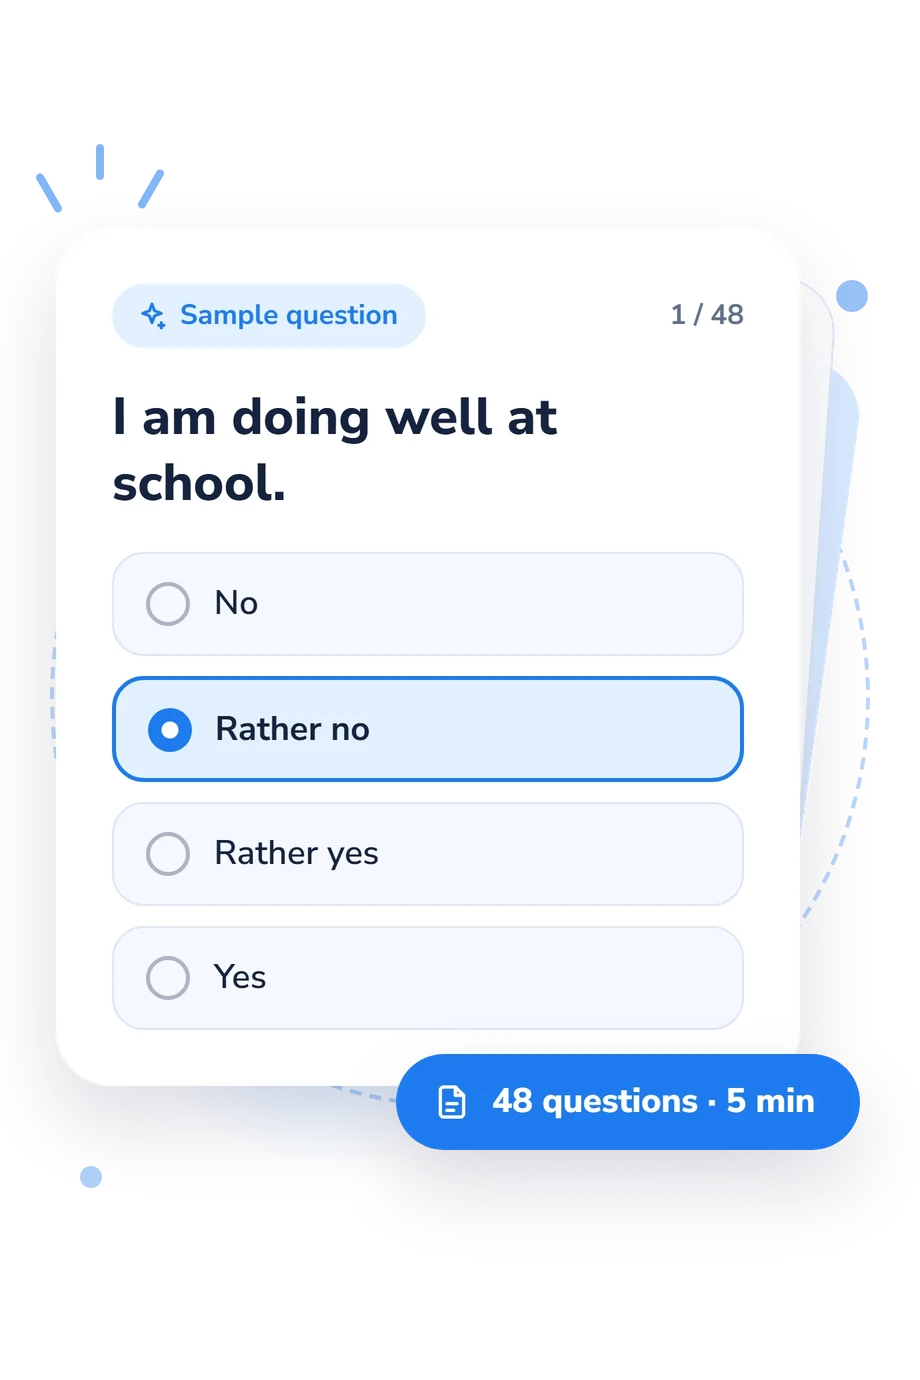
Example Questions From the Test
- No
- Probably no
- Probably yes
- Yes
- No
- Probably no
- Probably yes
- Yes
- No
- Probably not
- Probably yes
- Yes
School Subjective Well-Being Questionnaire Test - Description and methodology of the test
Students who want a clearer picture of how school feels day to day can use this questionnaire to reflect on health, emotions, learning conditions, and peer relationships. The School Subjective Well-Being Questionnaire Test is suited to a student considering whether school life feels supportive, stressful, satisfying, or mixed. As a school well-being questionnaire, it offers a profile rather than a single global judgment, making patterns easier to notice and discuss.
What This Questionnaire Measures
The questionnaire treats school well-being as multidimensional, combining physical condition, school satisfaction, emotional reactions, and peer relationships. This student well-being assessment can reveal uneven experiences, such as feeling satisfied with lessons while finding class relationships difficult.
The profile reports six dimensions, each on a 0-100 scale:
- Physical Well-Being (0-100) rates physical condition: Low well-being (0-49), Moderate well-being (50-74), High well-being (75-100).
- Cooperation With Classmates (0-100) rates mutual support: Low collaboration (0-39), Moderate collaboration (40-69), High collaboration (70-100).
- Hostility Toward Classmates (0-100) reads higher with less hostility: High hostility (0-33), Mixed/variable relations (34-66), Low hostility (67-100).
- Affect Toward School (0-100) captures emotional tone: Mostly negative (0-39), Mixed (40-69), Mostly positive (70-100).
- School Satisfaction (0-100) rates school approval: Low satisfaction (0-33), Moderate satisfaction (34-66), High satisfaction (67-100).
- Subjective Well-Being (0-100) summarizes school life: Low well-being (0-49), Moderate well-being (50-74), High well-being (75-100).
Methodology and Evidence Base
Items use short self-report judgments. School and relationship statements use four-point agreement or frequency options, while the energy and health items use five-point responses. The format captures both appraisals and recent experiences without relying on one response style.
Scoring presents responses as displayed scale scores, with higher values generally representing more favorable school experiences; the hostility dimension follows the direction stated in its result definition. The questionnaire is conceptually consistent with the Multicomponent school well-being model (Kanonire et al., 2020), not a direct adaptation of it. That model distinguishes school satisfaction, affect, peer communication, and physical well-being while allowing for an overall factor. The questionnaire also relates to the BASWBSS, the Classmates’ Friendship Relationships Questionnaire, and Ryff’s account of positive functioning.
These sources support the questionnaire’s conceptual coverage, but the displayed result should not be read as the published instruments’ norms or psychometric statistics. The result is a structured snapshot of subjective well-being at school. Mood, memory, interpretation, and willingness to disclose can affect self-report, so scores are most useful alongside context and changes over time.
- Kanonire, T., Federiakin, D. A., & Uglanova, I. L. (2020). Multicomponent framework for students’ subjective well-being in elementary school. School Psychology, 35(5), 321-331. 10.1037/spq0000397
- Tian, L., Wang, D., & Huebner, E. (2015). Development and Validation of the Brief Adolescents’ Subjective Well-Being in School Scale (BASWBSS). Social Indicators Research, 120(2), 615-634. 10.1007/s11205-014-0603-0
- Turilova-Miščenko, T., & Raščevska, M. (2008). Psychometric Properties of Classmates’ Friendship Relationships Questionnaire. Baltic Journal of Psychology, 9(1-2), 129-140.
- Ryff, C. D. (1989). Happiness is everything, or is it? Explorations on the meaning of psychological well-being. Journal of Personality and Social Psychology, 57(6), 1069-1081. 10.1037/0022-3514.57.6.1069
Updated: