
Rational-Experiential Inventory (REI) Test
How the Scales are Structured
Who Usually Takes This Test?
See How You Compare
Below is a preview of how scores are typically distributed across each scale.
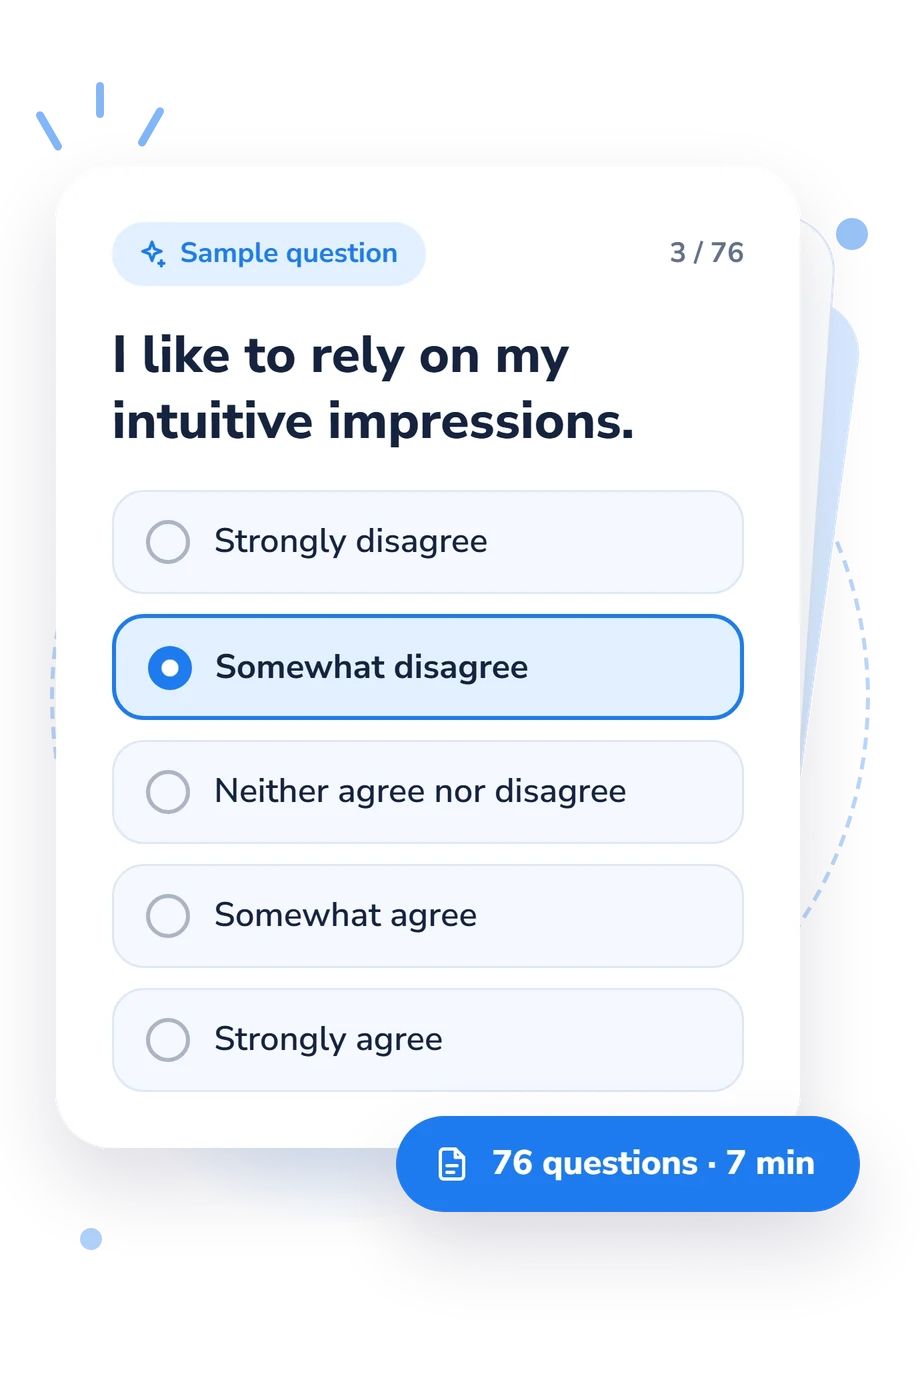
Example Questions From the Test
- Strongly disagree
- Somewhat disagree
- Neither agree nor disagree
- Somewhat agree
- Strongly agree
- Strongly disagree
- Somewhat disagree
- Neither agree nor disagree
- Somewhat agree
- Strongly agree
- Completely disagree
- Somewhat disagree
- Neither agree nor disagree
- Somewhat agree
- Completely agree
Rational-Experiential Inventory (REI) Test - Description and methodology of the test
For people examining their information-processing preferences, this questionnaire offers a structured way to reflect on how they interpret and organize experience. The Rational-Experiential Inventory (REI) Test can show reported use of intuitive and rational styles, perceived ability in each mode, and the strength of intuitive and rational processing tendencies. A rational thinking test of this kind is most useful as a prompt for noticing patterns, not ranking one style above another.
What This Assessment Explores
Intuitive thinking test scales are:
- Engagement (II), 1-5, measures intuitive use: Infrequent 1-2.6; Occasional 2.7-3.8; Frequent 3.9-5.
- Ability (IS), 1-5, measures intuitive perception, presentiment, and spontaneity: Lower intuition 1-2.7; Moderate intuition 2.8-4; Higher intuition 4.1-5.
- Intuition, 1-5, measures intuitive-affective reliance: Lower intuition 1-2.5; Moderate intuition 2.6-3.9; Higher intuition 4-5.
- Rational Use, 1-5, measures rational use: Infrequent use 1-2.6; Moderate use 2.7-3.9; Frequent use 4-5.
- Ability (rational), 1-5, measures logical/critical analysis: Lower rational abilities 1-2.6; Moderate rational abilities 2.7-3.9; High rational abilities 4-5.
- Rationality, 1-5, measures logical/analytical, evidence-based thinking: Low rationality 1-2.6; Moderate rationality 2.7-3.9; High rationality 4-5.
Methodology and Evidence Base
The items presented use a five-point agreement response, from strongly disagree to strongly agree, with a neutral midpoint. The statements cover intuition, reasoning, enjoyment of effort, and confidence in solving problems. The questionnaire reports the displayed scores on 1-5 scales; higher values indicate more frequent use, stronger preference, or greater perceived ability for that construct. The bands organize the profile; they do not establish that one mode is universally better.
The published Rational-Experiential Inventory is the relevant original instrument source. Later work by Pacini and Epstein and by Björklund and Bäckström provides supporting discussion and validity evidence for the inventory. Its themes are conceptually consistent with the published REI, while later papers offer context for the distinction between intuitive-experiential and analytical-rational processing.
The online format makes this a thinking style assessment and a self-report profile. Scores can reflect current context, self-awareness, and response bias; they do not show that hunches are accurate, logic is effortless, or a preferred mode suits every situation. It does not by itself establish a diagnosis.
- Pacini, R., & Epstein, S. (1999). The relation of rational and experiential information processing styles to personality, basic beliefs, and the ratio-bias phenomenon. Journal of Personality and Social Psychology, 76(6), 972-987. 10.1037/0022-3514.76.6.972
- Epstein, S., Pacini, R., Denes-Raj, V., & Heier, H. (1996). Individual differences in intuitive-experiential and analytical-rational thinking styles. Journal of Personality and Social Psychology, 71(2), 390-405. 10.1037/0022-3514.71.2.390
- Björklund, F., & Bäckström, M. (2008). Individual differences in processing styles: Validity of the Rational-Experiential Inventory. Scandinavian Journal of Psychology, 49(5), 439-446. 10.1111/j.1467-9450.2008.00652.x
Updated: