
Freudly+971 508685814hello@freudly.ai
Freudly
autism

Behavior Rating Inventory of Executive Function (BRIEF) Test
Take the online Behavior Rating Inventory of Executive Function (BRIEF) Test - AI psychologist FreudlyYou can take Behavior Rating Inventory of Executive Function (BRIEF) Testhere. Online version of a simple and accurate psychological test with interpretation.en
Get a clear snapshot of a child’s executive functioning in about 16 minutes. See strengths and concerns across planning, focus, self-control, and emotional regulation to guide next steps.
Start Online Test
Questions: 8616 minutes
08:30
October 2, 2025
October 2, 2025
Material has been updated
October 2, 2025
Material has been published
24,149 views
2,712 completions
2,121 likes
Verified by Daniel Hall
Psychologist with 25 years of experience
Share
Scale Explorer

How the Scales are Structured

example score
1/3
Initiate (I)
Assesses how independently a child initiates tasks and generates ideas without prompting.
Low
High
11.9: Low | 23: High
A score of 1 suggests the child may often need prompts to get started on tasks or to propose ideas.
example score
1/3
Behavioral Regulation Index (BRI)
Measures a child’s ability to regulate behavior by inhibiting impulses and reducing hyperactive responses.
Stronger regulation
Some difficulty
More difficulty
11.9: Stronger regulation | 22.4: Some difficulty | 2.53: More difficulty
A score of 1 falls in the “Stronger regulation” range, suggesting comparatively better inhibitory control and fewer impulsive or hyperactive behaviors on this scale.
example score
2/3
Metacognition Index (MI)
The Metacognitive Index reflects how well a child plans and organizes tasks, sustains goal-directed activity, and holds information in working memory.
Lower difficulties
Moderate difficulties
Higher difficulties
1: Lower difficulties | 2: Moderate difficulties | 3: Higher difficulties
A score of 2 suggests a moderate level of difficulty with planning, organization, sustained activity, and working memory in everyday situations.
example score
3/3
Emotional Control (EC)
Assesses how well a child regulates and modulates emotional reactions to fit the situation.
Typical regulation
Elevated difficulties
13: Typical regulation | 3: Elevated difficulties
A score of 3 falls in the Elevated difficulties range, suggesting more frequent challenges adjusting emotional responses to match situational demands.
example score
3/3
Shift (S)
Switching reflects cognitive flexibility and how readily a child can shift between tasks, rules, or aspects of a problem.
Lower difficulty
Higher difficulty
12: Lower difficulty | 3: Higher difficulty
A score of 3 falls in the Higher difficulty range, suggesting more frequent challenges with shifting between activities or adjusting to changes.
example score
3/3
Inhibit (I)
Assesses the child’s ability to inhibit impulses and stop inappropriate behavior at the appropriate moment.
Adequate inhibition
Elevated inhibition difficulties
1: Adequate inhibition | 23: Elevated inhibition difficulties
A score of 3 falls in the Elevated inhibition difficulties range, suggesting more frequent challenges with impulse control and stopping behavior when needed compared with peers.
example score
3/3
Organization of Materials (OoM)
This scale measures how well a child maintains order and organization in their work or play environment.
Lower orderliness
Higher orderliness
1: Lower orderliness | 23: Higher orderliness
A score of 3 suggests strong consistency in keeping materials and spaces orderly during activities.
example score
2/3
Planning (P)
Assesses the child’s ability to anticipate events, set goals, and sequence steps to achieve them.
Developing planning skills
Typical range
Strong planning skills
11.9: Developing planning skills | 22.4: Typical range | 2.53: Strong planning skills
A score of 2 suggests planning abilities are generally within the typical range, with occasional need for support when tasks are complex or multi-step.
example score
1/3
Working Memory (WM)
This scale measures how well the child can hold and manipulate information in mind long enough to complete tasks.
Low
High
11.9: Low | 23: High
A score of 1 falls in the Low range, suggesting the child may have more difficulty keeping information in mind while working through tasks.
example score
7/9
Negativity Scale (NS)
Assesses response validity by detecting a tendency toward unusually negative or distorted reporting about the child’s behavior.
Low negativity
Elevated negativity
High negativity
04: Low negativity | 56: Elevated negativity | 79: High negativity
A score of 7 falls in the High negativity range, suggesting the responses may be overly negative and should be interpreted with extra caution.
example score
3/3
Cognitive Control (CC)
Assesses how well a child monitors task performance and evaluates how their behavior affects others.
Lower cognitive control
Moderate cognitive control
Higher cognitive control
11.9: Lower cognitive control | 22.9: Moderate cognitive control | 3: Higher cognitive control
A score of 3 falls in the Higher cognitive control range, suggesting the child is typically effective at monitoring performance and considering the impact of their behavior on others.
example score
3/3
Global Executive Composite (GEC)
This index summarizes overall executive functioning by combining behavior regulation and metacognitive skills.
Lower
Higher
11.9: Lower | 23: Higher
A score of 3 falls in the Higher range, suggesting relatively stronger overall executive function skills across behavior regulation and metacognitive processes in everyday settings.
Start Online Test
just completed the test
DATA-BASED USER COHORTS

Who Usually Takes This Test?

School psychologists and counselors
41%OF USERS
Use it to quickly profile a student’s planning, impulse control, attention, and emotional regulation to guide supports at school.
Parents seeking clarity
34%OF USERS
Complete it to understand everyday executive function challenges at home and decide what kind of help or strategies to pursue.
Researchers in child development
25%OF USERS
Include it to compare executive function patterns across groups of children and track changes in studies.
BASED ON AGGREGATED, ANONYMIZED DATA FROM TENS OF THOUSANDS OF FREUDLY USERS.
Benchmarking

See How You Compare

Once you complete the test, your results are compared with real-world data from people in your country.
Below is a preview of how scores are typically distributed across each scale.
Initiative (I)
Initiative (I)
Average
2.5
Normal range
2.22.7
min.
1
max.
3
This curve shows how scores are typically distributed.
Once you complete the test, your result will appear on the scale so you can see how you compare.
Behavior Regulation Index (BRI)
Average
2.3
Normal range
22.6
min.
1
max.
3
This curve shows how scores are typically distributed.
Once you complete the test, your result will appear on the scale so you can see how you compare.
Metacognitive Index (MI)
Average
2.2
Normal range
1.92.5
min.
1
max.
3
This curve shows how scores are typically distributed.
Once you complete the test, your result will appear on the scale so you can see how you compare.
Emotional Control (EC)
Average
1.7
Normal range
1.42.1
min.
1
max.
3
This curve shows how scores are typically distributed.
Once you complete the test, your result will appear on the scale so you can see how you compare.
Switching (S)
Switching (S)
Average
2.4
Normal range
2.12.7
min.
1
max.
3
This curve shows how scores are typically distributed.
Once you complete the test, your result will appear on the scale so you can see how you compare.
Braking (B)
Braking (B)
Average
1.8
Normal range
1.52.1
min.
1
max.
3
This curve shows how scores are typically distributed.
Once you complete the test, your result will appear on the scale so you can see how you compare.
Order in Things (OiT)
Average
2.1
Normal range
1.82.4
min.
1
max.
3
This curve shows how scores are typically distributed.
Once you complete the test, your result will appear on the scale so you can see how you compare.
Planning (P)
Planning (P)
Average
2.1
Normal range
1.82.4
min.
1
max.
3
This curve shows how scores are typically distributed.
Once you complete the test, your result will appear on the scale so you can see how you compare.
Working Memory (WM)
Working Memory (WM)
Average
2.2
Normal range
1.92.4
min.
1
max.
3
This curve shows how scores are typically distributed.
Once you complete the test, your result will appear on the scale so you can see how you compare.
Negativity Scale (NS)
Average
4.4
Normal range
3.35.6
min.
0
max.
9
This curve shows how scores are typically distributed.
Once you complete the test, your result will appear on the scale so you can see how you compare.
Cognitive Control (CC)
Average
2.3
Normal range
1.92.7
min.
1
max.
3
This curve shows how scores are typically distributed.
Once you complete the test, your result will appear on the scale so you can see how you compare.
General Executive Function Index (GEFI)
Average
1.8
Normal range
1.52.1
min.
1
max.
3
This curve shows how scores are typically distributed.
Once you complete the test, your result will appear on the scale so you can see how you compare.
Featured On
SAMPLE QUESTIONS

Example Questions From the Test

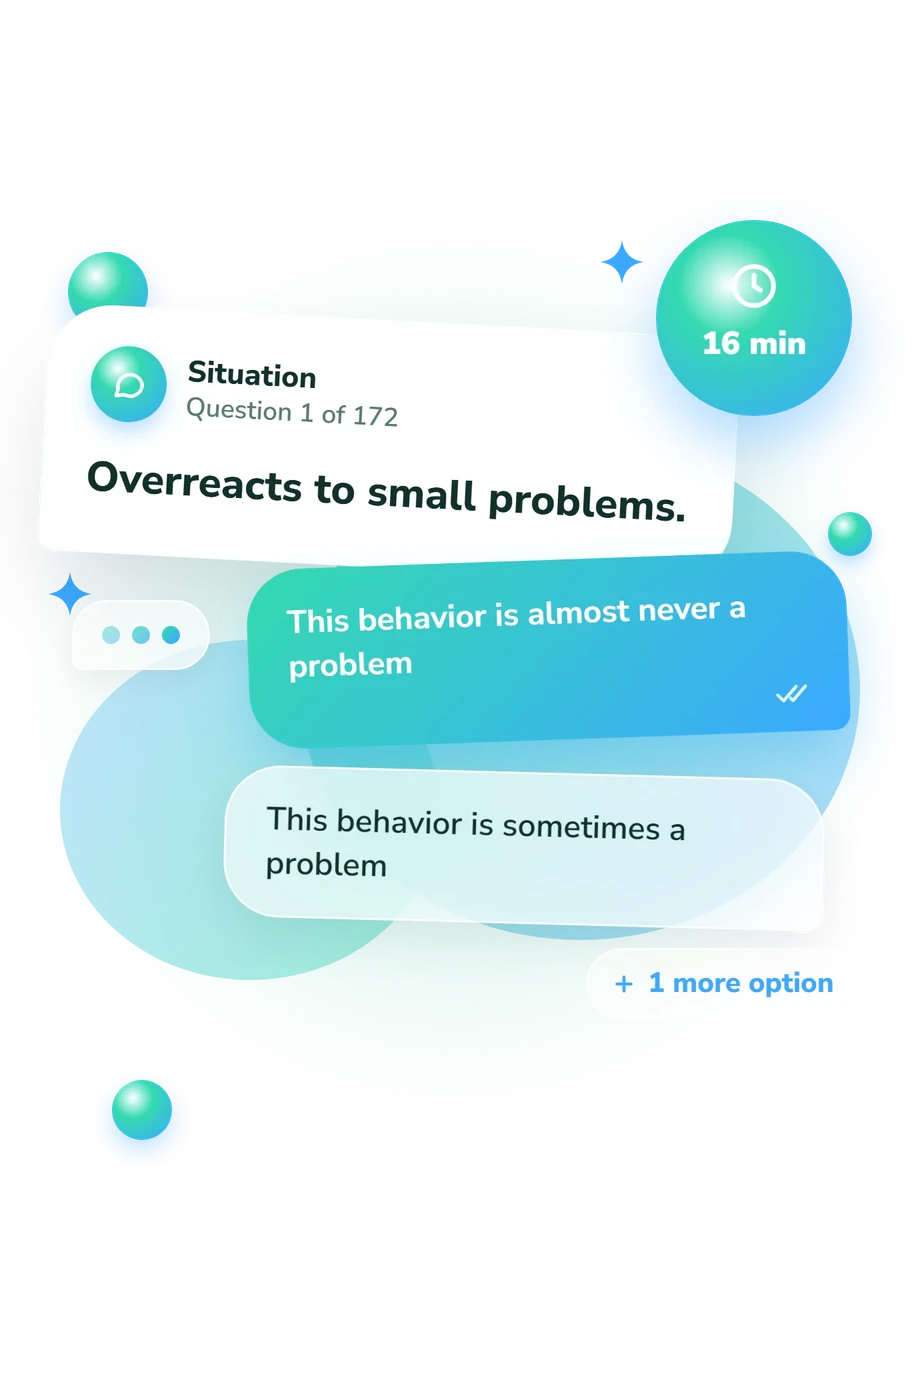
Below is a series of statements describing behavioral problems in children. We are interested in whether your child has had these problems during the past 6 months. Please answer all questions honestly and do not skip any statements. After reading each statement, think about your child and mark your response.
    • This behavior is almost never a problem
    • This behavior is sometimes a problem
    • This behavior is often a problem
    • This behavior is almost never a problem
    • This behavior is sometimes a problem
    • This behavior is often a problem
    • This kind of behavior is rarely a problem
    • Sometimes this kind of behavior is a problem
    • This kind of behavior is often a problem
WHAT THE TEST MEASURES
About This Assessment
Behavior Rating Inventory of Executive Function, BRIEF Test

Behavior Rating Inventory of Executive Function (BRIEF) Test - Symptoms and Signs

autism
deviations

This measure is commonly used to obtain informant ratings of everyday behaviors associated with executive functioning in children and adolescents. The Behavior Rating Inventory of Executive Function (BRIEF) provides a structured way for caregivers and/or teachers to report on planning/organization, inhibitory control, attention regulation, and emotional/behavioral self-management in real-world settings.

The questionnaire includes 86 items and typically requires about 16 minutes to complete. Responses yield scale scores that can be used to characterize relative strengths and concerns and to support clinical formulation, educational planning, and decisions about whether additional assessment is indicated.

The Behavior Rating Inventory of Executive Function (BRIEF) is intended to be interpreted within the context of its manual and other available information (e.g., developmental history, academic functioning, and direct assessment), rather than as a stand-alone diagnostic tool. Authors: Lauren Kenworthy; Steven C. Guy.

Author: Gerard A. Gioia, Lauren Kenworthy, Peter K. Isquith, Steven C. Guy
Literature: Anderson, P. Assessment and development of executive function (EF) during childhood. Child Neuropsychology. 2002.; Gioia, G. A., Isquith, P. K., Guy, S. C., & Kenworthy, L. Behavior rating inventory of executive function. Psychological Assessment Resources. 2000.
Popular tests
Comments
Leave a Comment