
Athlete Mental Reliability Scale (PNS-40) Test
How the Scales are Structured
Who Usually Takes This Test?
See How You Compare
Below is a preview of how scores are typically distributed across each scale.
Example Questions From the Test
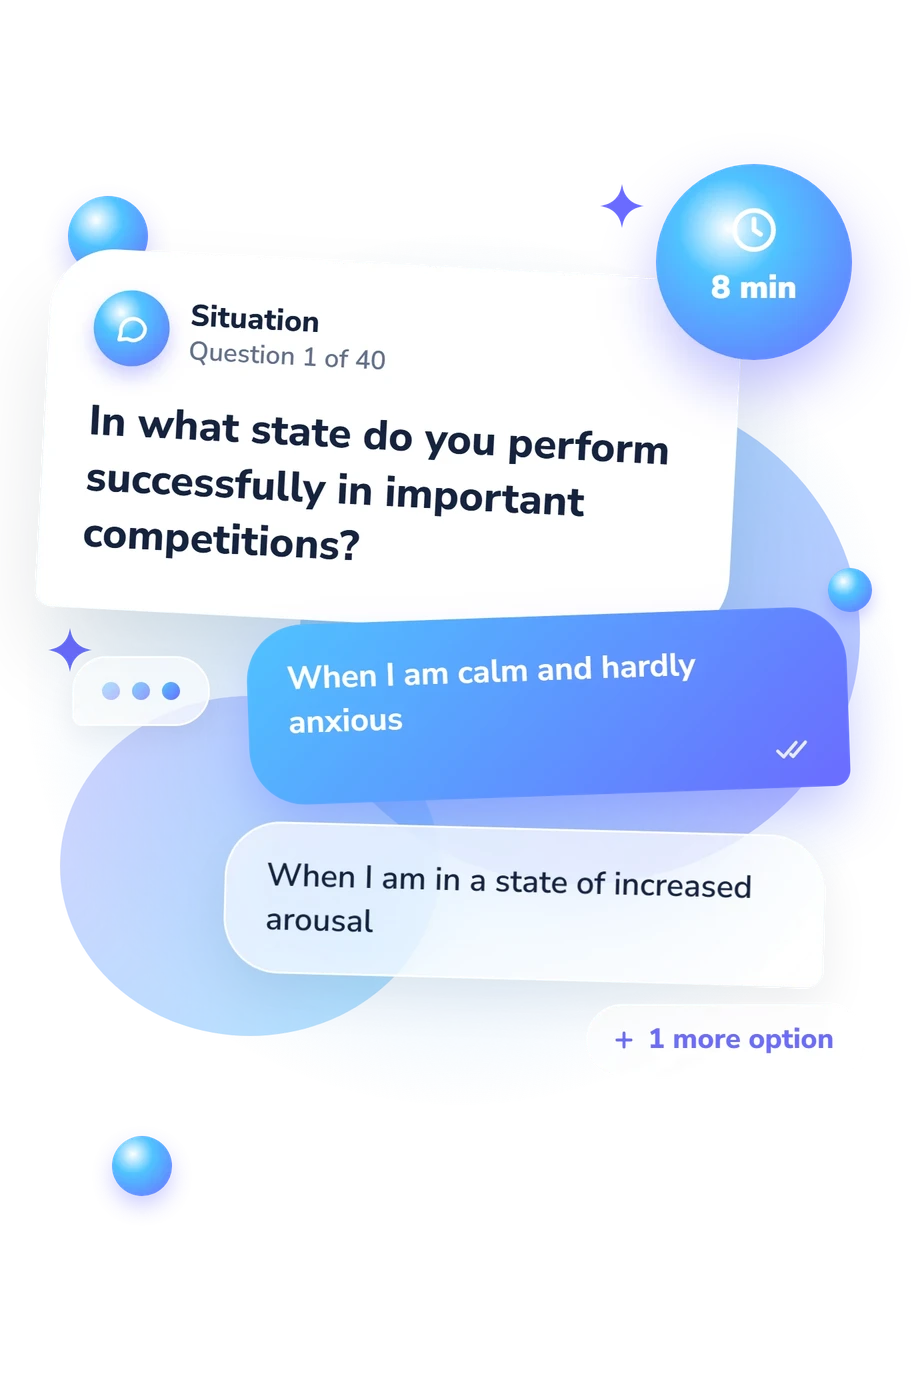
- When I am calm and hardly anxious
- When I am in a state of increased arousal
- When I am in a state of strong arousal
- Yes
- Sometimes
- No
- I usually do not think about it
- Sometimes
- Yes
Athlete Mental Reliability Scale (PNS-40) Test - Description and methodology of the test
Athletes who want to understand how pressure shapes their performance can use the Athlete Mental Reliability Scale (PNS-40) Test as a structured self-reflection tool. This athlete mental reliability assessment is intended for competitors at any experience level who want to examine preparation, reactions, and psychological resources. Results offer a profile of tendencies to explore in training and competition review.
What This Assessment Explores
The questionnaire is intended for athletes who want to understand how nervousness, expectations, and changing conditions affect execution. It addresses successful and inconsistent performance, mental preparation, difficult opponents, fear of injury or defeat, demanding training, and concern about disappointing a coach or team. These situations connect competitive behavior with the athlete’s interpretation of pressure.
As a mental reliability test for athletes, it explores several related dimensions rather than treating confidence as the whole explanation. The profile considers external focus, inner uncertainty, stress response, concentration, effort, emotional control, and competitive steadiness. Results can help identify patterns for targeted preparation and post-competition reflection. It may be useful before a season, after a demanding event, or when performance feels less stable than expected.
Methodology and Evidence Base
Items use self-report with two- or three-option answers, plus longer choices about preparation and reactions. Scores are separate by dimension. As a PNS-40 psychological test, bands describe tendencies.
The result dimensions are:
- External Significance (0-8) and Internal Significance (0-8) compare outer and inner focus: Internally guided 0-2; Balanced focus 3-5; Externally dependent 6-8; Low 0-2; Moderate 3-5; High 6-8.
- External Uncertainty (0-8) and Internal Uncertainty (0-8) compare situational and inner doubt: Low 0-2; Moderate 3-5; High 6-8; Low uncertainty 0-2; Moderate uncertainty 3-5; High uncertainty 6-8.
- Sensitivity to Stressors (0-32) and Stability and Distraction Resistance (-6-3) cover stress and steadiness: Low sensitivity 0-7; Moderate sensitivity 8-12; High sensitivity 13-32; Low stability -6--1; Moderate stability 0-2; High stability 3-3.
- Motivational-Energy Component (-10-7), Self-Regulation (-10-6), and Competitive Emotional Stability (-12-5) cover drive, control, and balance: Low drive/energy -10--1; High drive/energy 0-7; Low -10--1; Moderate-High 0-6; Low resilience -12--1; Moderate resilience 0-0; High resilience 1-5.
These results are conceptually consistent with Mental Reliability of an Athlete (Milman, 1983) and Milman’s 1976 model work; Vorobyova (2026) offers later context. The questionnaire is not a standardized adaptation, and mood, recall, and self-awareness can influence responses.
- Vorobyova, S. M. (2026). Mental Reliability of Student-Athletes in Competitive Shooting. Human. Sport. Medicine, 25(3), 93-98. 10.14529/hsm250312
- Milman, V. E. (1983). Stress and Personality Factors of Regulation of Activity. In V. E. Milman (Ed.), Stress and Anxiety in Sports (pp. 24-46). Moscow: FIS.
- Milman, V. E. (1976). Structure and Methodology of Compiling Model Psychological Characteristics Related to the Mental Reliability of Athletes. Moscow: Fizkultura i Sport, 46 pp.
Updated: