
Freudly+971 508685814hello@freudly.ai
Freudly
security

Quality of Interpersonal Relationships in the Educational Environment Test
Take the online Quality of Interpersonal Relationships in the Educational Environment Test - AI psychologist FreudlyYou can take Quality of Interpersonal Relationships in the Educational Environment Testhere. Online version of a simple and accurate psychological test with interpretation.en
In 9 minutes, understand how supportive student and teacher relationships feel and how safe the school climate is. Get clear, actionable insights to spot trouble areas fast and guide timely support.
Start Online Test
Questions: 489 minutes
08:30
October 2, 2025
October 2, 2025
Material has been updated
October 2, 2025
Material has been published
16,444 views
1,083 completions
942 likes
Verified by Daniel Hall
Psychologist with 25 years of experience
Share
Scale Explorer

How the Scales are Structured

example score
14/24
Manipulative Attitude (MA)
Measures the tendency to use covert pressure and insincere strategies to influence others in interpersonal interactions at school.
Low
Moderate
High
07: Low | 816: Moderate | 1724: High
A score of 14 falls in the Moderate range, suggesting a noticeable but not predominant tendency toward manipulative interaction patterns.
example score
10/24
Hostility (H)
Measures the level of negative attitudes and ill will in relationships within the educational environment.
Low hostility
Moderate hostility
High hostility
07: Low hostility | 816: Moderate hostility | 1724: High hostility
A score of 10 indicates a moderate level of hostility, suggesting some negative attitudes may be present but are not pronounced.
example score
13/24
Conflict Proneness (CP)
Measures the tendency for conflict situations and disagreements to arise and develop in the educational environment.
Low conflict
Moderate conflict
High conflict
07: Low conflict | 816: Moderate conflict | 1724: High conflict
A score of 13 falls in the Moderate conflict range, suggesting occasional disagreements that may affect day-to-day interactions but are not consistently pervasive.
example score
14/24
Aggression (A)
Measures the degree of aggressive behavior and conflict tendency in interpersonal interactions within the educational environment.
Low
Moderate
High
07: Low | 816: Moderate | 1724: High
A score of 14 falls in the Moderate range, suggesting noticeable but not extreme aggressiveness that may be associated with increased tension and occasional conflicts.
example score
11/24
Negative Attitude Index (NAI)
Measures the intensity of negative interpersonal relationship features such as conflict, hostility, aggressiveness, and manipulativeness in the educational environment.
Low
Moderate
High
07: Low | 816: Moderate | 1724: High
A score of 11 falls in the Moderate range, indicating a noticeable but not extreme level of negative interaction signs that may reflect some tension in relationships.
example score
13/24
Tolerance (T)
Measures acceptance and respect for differences among participants in the educational environment as an indicator of interaction climate.
Low tolerance
Moderate tolerance
High tolerance
07: Low tolerance | 816: Moderate tolerance | 1724: High tolerance
A score of 13 indicates a moderate level of tolerance, suggesting generally acceptable respect for differences with some room to strengthen inclusivity in day-to-day interactions.
example score
9/24
Acceptance (A)
Measures the extent to which members of the educational environment accept one another as they are, reflecting tolerance and lack of bias.
Low acceptance
Moderate acceptance
High acceptance
08: Low acceptance | 916: Moderate acceptance | 1724: High acceptance
A score of 9 falls in the Moderate acceptance range, suggesting acceptance is present but may be inconsistent across interactions or situations.
example score
7/24
Benevolence (B)
Measures the degree of friendliness, mutual support, and respect in interpersonal relationships within the educational environment.
Low friendliness
Moderate friendliness
High friendliness
07: Low friendliness | 816: Moderate friendliness | 1724: High friendliness
A score of 7 falls in the Low friendliness range, suggesting limited expressions of mutual support and respect in current relationships.
example score
15/24
Trust (T)
Assesses how much participants in the educational environment feel openness and confidence in their interactions with one another.
Low trust
Moderate trust
High trust
07: Low trust | 816: Moderate trust | 1724: High trust
A score of 15 falls in the Moderate trust range, suggesting generally trusting interactions with some remaining caution or inconsistency in openness.
example score
17/24
Positive Attitude Index (PAI)
Measures how strongly positive, supportive qualities (trust, kindness, acceptance, tolerance) are expressed in interpersonal relationships within the educational environment.
Low
Moderate
High
07: Low | 816: Moderate | 1724: High
A score of 17 falls in the High range, suggesting that positive and supportive interaction patterns are strongly expressed in this educational setting.
Start Online Test
just completed the test
DATA-BASED USER COHORTS

Who Usually Takes This Test?

School psychologists and counselors
41%OF USERS
They use it for rapid screening of class climate and psychological safety, especially after incidents or when supporting at-risk students.
Teachers and class advisors
34%OF USERS
They take it to understand student–student and teacher–student dynamics and adjust classroom management and communication.
Adolescent students
25%OF USERS
They complete it to share how safe, supported, and comfortable they feel in their school and classroom relationships.
BASED ON AGGREGATED, ANONYMIZED DATA FROM TENS OF THOUSANDS OF FREUDLY USERS.
Benchmarking

See How You Compare

Once you complete the test, your results are compared with real-world data from people in your country.
Below is a preview of how scores are typically distributed across each scale.
Manipulative Relationships Scale (MRS)
Average
14.9
Normal range
11.218.7
min.
0
max.
24
This curve shows how scores are typically distributed.
Once you complete the test, your result will appear on the scale so you can see how you compare.
Hostility Scale (HS)
Average
14.1
Normal range
9.718.5
min.
0
max.
24
This curve shows how scores are typically distributed.
Once you complete the test, your result will appear on the scale so you can see how you compare.
Conflict Scale (CS)
Conflict Scale (CS)
Average
6.3
Normal range
3.29.4
min.
0
max.
24
This curve shows how scores are typically distributed.
Once you complete the test, your result will appear on the scale so you can see how you compare.
Aggressiveness Scale (AS)
Average
7.8
Normal range
4.411.2
min.
0
max.
24
This curve shows how scores are typically distributed.
Once you complete the test, your result will appear on the scale so you can see how you compare.
Negative Attitude Index (NAI)
Average
12.4
Normal range
9.115.8
min.
0
max.
24
This curve shows how scores are typically distributed.
Once you complete the test, your result will appear on the scale so you can see how you compare.
Tolerance Scale (TS)
Average
6.4
Normal range
3.29.5
min.
0
max.
24
This curve shows how scores are typically distributed.
Once you complete the test, your result will appear on the scale so you can see how you compare.
Acceptance Scale (AS)
Average
13
Normal range
9.416.6
min.
0
max.
24
This curve shows how scores are typically distributed.
Once you complete the test, your result will appear on the scale so you can see how you compare.
Friendliness Scale (FS)
Average
16.3
Normal range
12.719.9
min.
0
max.
24
This curve shows how scores are typically distributed.
Once you complete the test, your result will appear on the scale so you can see how you compare.
Trust Scale (TS)
Trust Scale (TS)
Average
16.1
Normal range
12.919.3
min.
0
max.
24
This curve shows how scores are typically distributed.
Once you complete the test, your result will appear on the scale so you can see how you compare.
Positive Attitude Index (PAI)
Average
12.2
Normal range
915.5
min.
0
max.
24
This curve shows how scores are typically distributed.
Once you complete the test, your result will appear on the scale so you can see how you compare.
Featured On
SAMPLE QUESTIONS

Example Questions From the Test

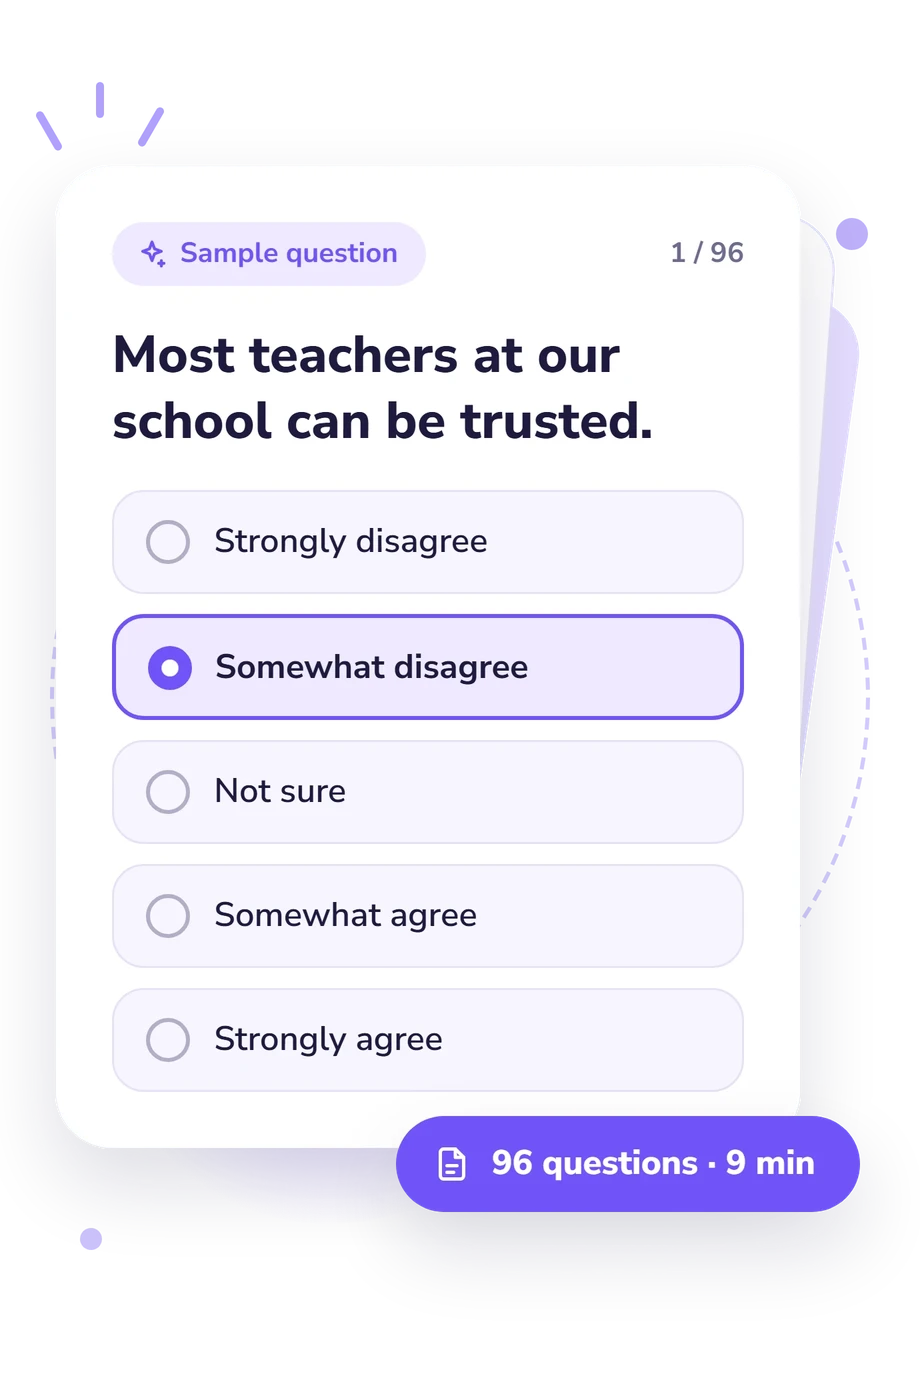
Dear student, Please answer the questions in this questionnaire. The questions and statements concern your school and relationships among students, as well as between students and teachers. For each question, select only one response option. Choose the option that best reflects the extent to which you agree with the statement. There are no right or wrong answers. It is important to understand what is actually happening.
    • Strongly disagree
    • Disagree
    • Not sure
    • Agree
    • Strongly agree
    • Strongly disagree
    • Somewhat disagree
    • Hard to say
    • Somewhat agree
    • Strongly agree
    • Strongly disagree
    • Somewhat disagree
    • Difficult to say
    • Somewhat agree
    • Strongly agree
WHAT THE TEST MEASURES
About This Assessment
Quality of Interpersonal Relationships in the Educational Environment Test

Quality of Interpersonal Relationships in the Educational Environment Test - Symptoms and Signs

security
class climate
pedagogy

This measure is designed to support rapid screening of perceived relationship quality and psychological safety within school settings. Quality of Interpersonal Relationships in the Educational Environment is intended to help characterize how students and staff experience the social climate and day-to-day interactions.

The instrument includes 48 items and typically takes about 9 minutes to complete. Content emphasizes interpersonal dynamics (e.g., peer relationships and student-teacher interactions) and perceived comfort and safety in the educational environment, and it may be used to inform targeted consultation, classroom-level supports, or broader school climate efforts. Development is attributed to Urie Bronfenbrenner and John C. Flanagan.

Quality of Interpersonal Relationships in the Educational Environment is generally interpreted as a descriptive indicator of perceived school climate rather than a diagnostic tool; results should be considered alongside other sources of information (e.g., interviews, observation, and additional rating scales) and the respondent’s context.

Author: John C. Flanagan, Urie Bronfenbrenner
Literature: Cohen, J., & Wills, T. A. Stress, social support, and the buffering hypothesis. Psychological Bulletin. 1985.
Popular tests
Comments
Leave a Comment