
Freudly+971 508685814hello@freudly.ai
Freudly
locus of control

Locus of Control Test
Take the online Locus of Control Test - AI psychologist FreudlyYou can take Locus of Control Testhere. Online version of a simple and accurate psychological test with interpretation.en
Understand how someone views control over life outcomes in about 6 minutes. Get a detailed, reliable profile to guide coaching, counseling, hiring, and development.
Start Online Test
Questions: 406 minutes
08:30
October 2, 2025
October 2, 2025
Material has been updated
October 2, 2025
Material has been published
21,781 view
1,909 completions
1,648 likes
Verified by Daniel Hall
Psychologist with 25 years of experience
Share
Scale Explorer

How the Scales are Structured

example score
3/8
Planning Readiness (PR)
Measures readiness to independently plan and carry out activities while taking responsibility for outcomes.
Low readiness
Moderate readiness
High readiness
03: Low readiness | 4: Moderate readiness | 58: High readiness
A score of 3 suggests lower readiness for independent planning and a tendency to rely more on external structure or guidance when organizing and owning tasks.
example score
3/8
Readiness to Overcome Difficulties (RtOD)
Measures how ready a person feels to engage in activities that involve overcoming obstacles and challenges.
Lower readiness
Moderate readiness
High readiness
03: Lower readiness | 45: Moderate readiness | 68: High readiness
A score of 3 suggests lower readiness to take on or persist through difficult tasks compared with higher scores on this scale.
example score
7/16
Denial of Agency (DoA)
Measures the extent to which a person views their actions as ineffective, reflecting externality versus readiness for active self-directed influence.
Low denial (more internal)
Borderline
High denial (more external)
08: Low denial (more internal) | 9: Borderline | 1016: High denial (more external)
A score of 7 falls in the low-denial range, suggesting a more internal orientation and greater readiness to see personal actions as meaningful.
example score
3/8
Internality in the Health Domain (IitHD)
Measures the extent to which a person attributes health outcomes and health-related behaviors to their own actions versus external factors.
More external
Mixed
More internal
03: More external | 45: Mixed | 68: More internal
A score of 3 falls in the “More external” range, suggesting health outcomes may be perceived as influenced more by circumstances than by personal control.
example score
3/8
Internality in Family Relationships (IiFR)
Measures the extent to which a person attributes outcomes in family and marital relationships to their own actions versus external circumstances.
More external
Mixed
More internal
03: More external | 4: Mixed | 58: More internal
A score of 3 falls in the “More external” range, suggesting the person more often sees family-related outcomes as shaped by circumstances or other people rather than their own influence.
example score
4/8
Responsibility in Interpersonal Relationships (RiIR)
Measures the extent to which a person feels personally responsible for outcomes in interpersonal (international-relations) interactions.
Lower responsibility
Moderate responsibility
Higher responsibility
03: Lower responsibility | 4: Moderate responsibility | 58: Higher responsibility
A score of 4 suggests a moderate tendency to take responsibility in interpersonal relationships, balancing personal accountability with consideration of external factors.
example score
4/8
Interpersonal Competence (IC)
Assesses how competent a person perceives themselves to be in managing and building interpersonal relationships.
Lower perceived competence
Moderate perceived competence
Higher perceived competence
03: Lower perceived competence | 4: Moderate perceived competence | 58: Higher perceived competence
A score of 4 suggests a moderate level of perceived competence in interpersonal relationships, indicating a balanced view of one’s interpersonal skills.
example score
10/16
Internality in Interpersonal Relations (IiIR)
Measures how much a person sees themselves as actively shaping and maintaining their interpersonal relationships.
Low internality
Moderate internality
High internality
08: Low internality | 9: Moderate internality | 1016: High internality
A score of 10 suggests a higher tendency to view the quality and direction of communication as influenced by your own actions rather than mainly by others or circumstances.
example score
4/8
Professional Process Skills (PPS)
Measures how developed the practical skills are for sustaining the day-to-day process of professional activity.
Skill gaps
Developing skills
Well-developed skills
03: Skill gaps | 4: Developing skills | 58: Well-developed skills
A score of 4 indicates developing skills, suggesting professional tasks are generally manageable but may require extra effort or support in some process-related areas.
example score
4/8
Occupational-Social Aspect (OSA)
Measures the tendency to take initiative and assume responsibility in professional and social interactions at work with supervisors and colleagues.
Lower initiative
Moderate initiative
Higher initiative
04: Lower initiative | 5: Moderate initiative | 68: Higher initiative
A score of 4 falls in the Lower initiative range, suggesting a comparatively lower tendency to take the lead and assume responsibility in workplace social interactions.
example score
8/16
Internality in Professional Activity (IiPA)
Measures how strongly a person tends to take personal responsibility for outcomes in professional or academic goal-directed activities.
Lower internality
Higher internality
08: Lower internality | 916: Higher internality
A score of 8 indicates a lower tendency to attribute work or study outcomes to one’s own actions, with responsibility for results more often perceived as unclear or externally influenced.
example score
-3/8
Self-Blame Proneness (SBP)
Measures the tendency to blame oneself for failures and attribute successes to external circumstances versus the opposite attribution pattern.
Lower self-blame
Optimal balance
Higher self-blame
-8-1: Lower self-blame | 0: Optimal balance | 18: Higher self-blame
A score of -3 falls in the Lower self-blame range, suggesting you are more likely to see successes as stemming from your own actions and failures as influenced by external circumstances.
example score
4/8
Internality in the Domain of Failures (IitDoF)
Measures the extent to which a person attributes failures to their own actions versus external circumstances.
More external attribution
More internal responsibility
04: More external attribution | 58: More internal responsibility
A score of 4 suggests a tendency to lean toward external explanations for failures rather than taking personal responsibility.
example score
4/8
Internality in the Achievement Domain (IitAD)
Measures the extent to which a person attributes achievements and success to their own actions and effort versus external circumstances.
Low internality
Moderate internality
High internality
04: Low internality | 5: Moderate internality | 68: High internality
A score of 4 indicates low internality in achievement, suggesting success is more often seen as shaped by external factors than by personal effort.
example score
5/20
Internality in Describing Personal Experience (IiDPE)
Measures the extent to which a person attributes their personal experiences and emotional states to their own actions and choices rather than external circumstances.
Low internality
High internality
010: Low internality | 1120: High internality
A score of 5 indicates low internality in describing personal experience, meaning personal experiences are more often explained by external factors than by one’s own actions.
example score
8/20
Internality in General Life Description (IiGLD)
Measures the extent to which a person tends to view their overall life outcomes as primarily shaped by their own actions versus external circumstances.
More external
More internal
010: More external | 1120: More internal
A score of 8 falls in the “More external” range, suggesting you more often explain life events in general through circumstances, chance, or other people rather than your own influence.
example score
9/40
Internality–Externality (IE)
Measures whether a person tends to attribute life outcomes to their own actions and responsibility (internality) versus external forces and circumstances (externality).
Externality
Internality
020: Externality | 2140: Internality
A score of 9 falls in the Externality range, suggesting a stronger tendency to view outcomes as shaped by outside factors rather than personal control.
Start Online Test
just completed the test
DATA-BASED USER COHORTS

Who Usually Takes This Test?

Self-development seekers
41%OF USERS
People who want to understand whether they take responsibility for outcomes or blame circumstances, so they can change habits and build confidence.
Coaching and therapy clients
34%OF USERS
Clients in counseling or coaching who need a clear profile of how they explain successes and failures to set realistic goals and track progress.
HR and team leaders
25%OF USERS
Managers and HR specialists assessing initiative, accountability, and risk readiness to support hiring, onboarding, or team development decisions.
BASED ON AGGREGATED, ANONYMIZED DATA FROM TENS OF THOUSANDS OF FREUDLY USERS.
Benchmarking

See How You Compare

Once you complete the test, your results are compared with real-world data from people in your country.
Below is a preview of how scores are typically distributed across each scale.
Readiness for Planning (RfP)
Average
4.7
Normal range
3.46.1
min.
0
max.
8
This curve shows how scores are typically distributed.
Once you complete the test, your result will appear on the scale so you can see how you compare.
Readiness to Overcome Difficulties (RtOD)
Average
4.7
Normal range
3.46
min.
0
max.
8
This curve shows how scores are typically distributed.
Once you complete the test, your result will appear on the scale so you can see how you compare.
Denial of activity (Doa)
Average
9.1
Normal range
6.112.1
min.
0
max.
16
This curve shows how scores are typically distributed.
Once you complete the test, your result will appear on the scale so you can see how you compare.
Internality in the Health Domain (IitHD)
Average
3.6
Normal range
2.25
min.
0
max.
8
This curve shows how scores are typically distributed.
Once you complete the test, your result will appear on the scale so you can see how you compare.
Internality in the Realm of Family Relationships (IitRoFR)
Average
2.3
Normal range
0.93.7
min.
0
max.
8
This curve shows how scores are typically distributed.
Once you complete the test, your result will appear on the scale so you can see how you compare.
Responsibility in the field of international relations (Ritfoir)
Average
2.5
Normal range
1.43.6
min.
0
max.
8
This curve shows how scores are typically distributed.
Once you complete the test, your result will appear on the scale so you can see how you compare.
Competence in the field of interpersonal relationships (Citfoir)
Average
3
Normal range
1.64.3
min.
0
max.
8
This curve shows how scores are typically distributed.
Once you complete the test, your result will appear on the scale so you can see how you compare.
Internality in the Sphere of Interpersonal Relationships (IitSoIR)
Average
7.7
Normal range
4.810.6
min.
0
max.
16
This curve shows how scores are typically distributed.
Once you complete the test, your result will appear on the scale so you can see how you compare.
Professional-Process Aspect (PA)
Average
3.9
Normal range
2.85
min.
0
max.
8
This curve shows how scores are typically distributed.
Once you complete the test, your result will appear on the scale so you can see how you compare.
Professional and social aspect (Pasa)
Average
5
Normal range
3.86.2
min.
0
max.
8
This curve shows how scores are typically distributed.
Once you complete the test, your result will appear on the scale so you can see how you compare.
Internality in Professional Activity (IiPA)
Average
10.8
Normal range
8.712.8
min.
0
max.
16
This curve shows how scores are typically distributed.
Once you complete the test, your result will appear on the scale so you can see how you compare.
Predisposition to self-blame (Pts)
Average
3.4
Normal range
0.56.2
min.
-8
max.
8
This curve shows how scores are typically distributed.
Once you complete the test, your result will appear on the scale so you can see how you compare.
Internality in the Domain of Failures (IitDoF)
Average
4.9
Normal range
3.66.2
min.
0
max.
8
This curve shows how scores are typically distributed.
Once you complete the test, your result will appear on the scale so you can see how you compare.
Internality in the Domain of Achievement (IitDoA)
Average
5.8
Normal range
4.57
min.
0
max.
8
This curve shows how scores are typically distributed.
Once you complete the test, your result will appear on the scale so you can see how you compare.
Internality in Describing Personal Experience (IiDPE)
Average
11.6
Normal range
8.714.5
min.
0
max.
20
This curve shows how scores are typically distributed.
Once you complete the test, your result will appear on the scale so you can see how you compare.
Internality in Describing Life in General (IiDLiG)
Average
13.6
Normal range
10.416.8
min.
0
max.
20
This curve shows how scores are typically distributed.
Once you complete the test, your result will appear on the scale so you can see how you compare.
Externality – Internality (E–I)
Average
12.2
Normal range
618.4
min.
0
max.
40
This curve shows how scores are typically distributed.
Once you complete the test, your result will appear on the scale so you can see how you compare.
Featured On
SAMPLE QUESTIONS

Example Questions From the Test

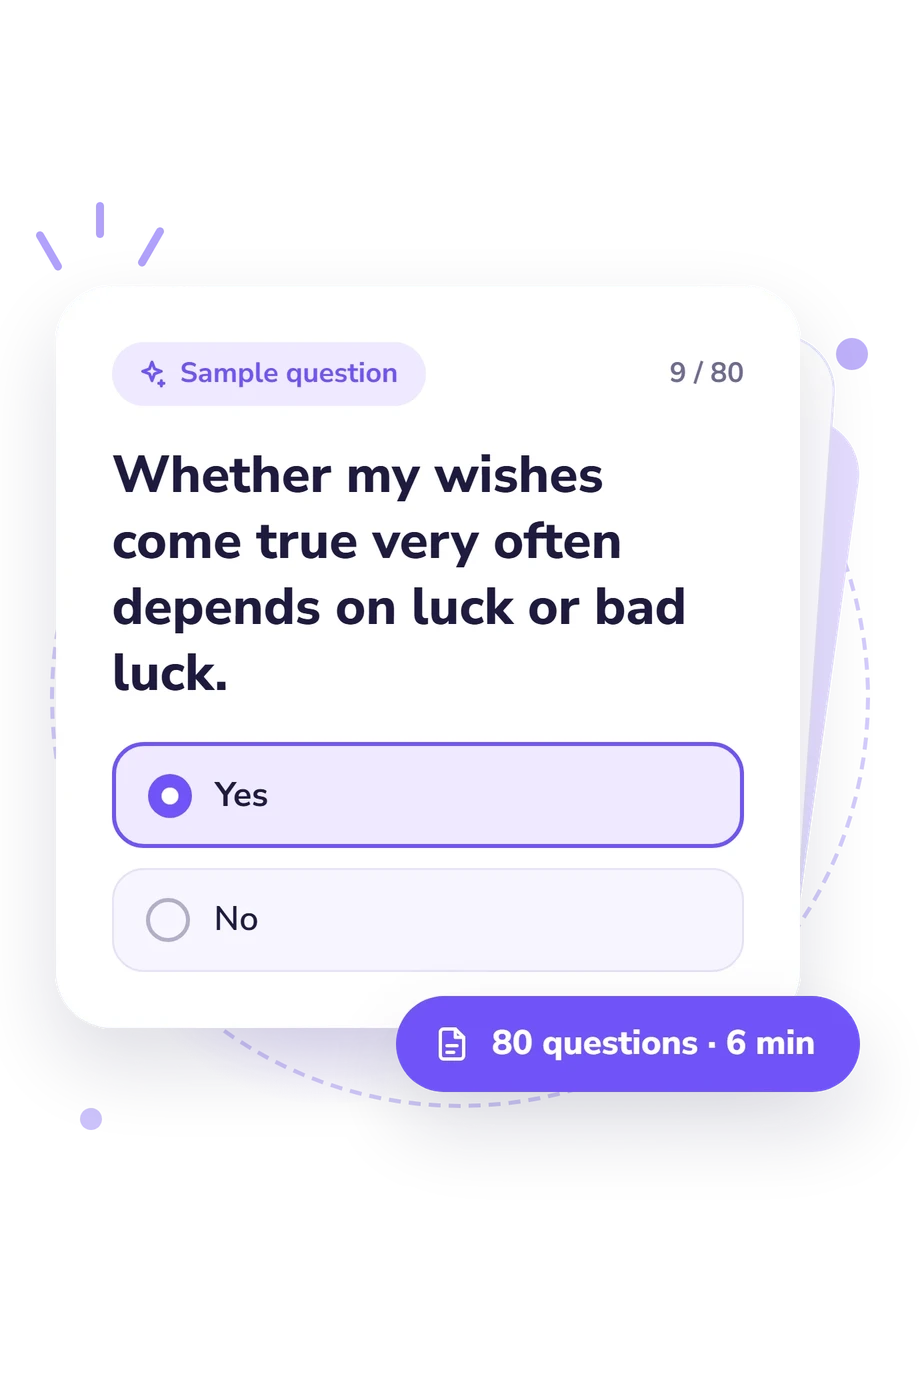
You will be presented with statements about life. You may agree or disagree with each statement. If you think, “Yes, I feel about the same,” select “Yes.” If you think, “No, I feel differently,” select “No.”
    • Yes
    • No
    • Yes
    • No
    • Yes
    • No
WHAT THE TEST MEASURES
About This Assessment
Locus of Control, LoC Test

Locus of Control Test - Symptoms and Signs

locus of control

This measure is used to evaluate how an individual perceives control over life events; Locus of Control focuses on the degree to which outcomes are attributed to personal actions versus external circumstances. It is commonly applied in clinical and counseling settings to inform case conceptualization and goal setting.

The instrument consists of 40 items and typically requires about 6 minutes to complete. Item responses are scored to yield an index reflecting internal versus external control orientation, which may help contextualize coping style, perceived responsibility, and responses to success and setbacks.

In practice, Locus of Control can support screening and treatment planning by clarifying attributional patterns that may be relevant to motivation, engagement, and adjustment. Authors: J. B. Rotter.

Author: J. B. Rotter
Literature: Rotter, J. B. Generalized expectancies for internal versus external control of reinforcement. Psychological Monographs. 1966.
Popular tests
Comments
Leave a Comment