
Freudly+971 508685814hello@freudly.ai
Freudly
job satisfaction

Overall Job Satisfaction Test
Take the online Overall Job Satisfaction Test - AI psychologist FreudlyYou can take Overall Job Satisfaction Testhere. Online version of a simple and accurate psychological test with interpretation.en
Understand what’s driving your job satisfaction in about 6 minutes. Get a fast, well-rounded snapshot of morale across work fit, relationships, pay priorities, and conditions to guide next steps.
Start Online Test
Questions: 326 minutes
08:30
October 2, 2025
October 2, 2025
Material has been updated
October 2, 2025
Material has been published
30,353 views
3,439 completions
3,018 likes
Verified by Daniel Hall
Psychologist with 25 years of experience
Share
Scale Explorer

How the Scales are Structured

example score
2/8
Satisfaction With Working Conditions (SWWC)
This scale measures how well the physical and organizational work environment aligns with an employee’s needs and expectations.
Low satisfaction
Moderate satisfaction
High satisfaction
02: Low satisfaction | 35: Moderate satisfaction | 68: High satisfaction
A score of 2 indicates low satisfaction with working conditions, suggesting the current work environment is not meeting expectations in several areas.
example score
3/8
Satisfaction With Management (SWM)
This scale measures how satisfied a person is with their relationship with management, including perceived trust and support from supervisors.
Low satisfaction
Moderate satisfaction
High satisfaction
02: Low satisfaction | 35: Moderate satisfaction | 68: High satisfaction
A score of 3 suggests moderate satisfaction with management, indicating some trust or support is present but there may be notable areas of friction or unmet expectations.
example score
5/8
Satisfaction With Colleagues (SWC)
This scale measures how satisfied a person is with relationships and day-to-day interactions with colleagues and management at work.
Low
Moderate
High
02: Low | 35: Moderate | 68: High
A score of 5 indicates moderate satisfaction with workplace relationships, suggesting generally acceptable interactions with some areas that may feel strained or could be improved.
example score
2/8
Satisfaction With Achievements (SWA)
This scale measures how satisfied a person is with their achievements and results at work.
Low
Moderate
High
02: Low | 35: Moderate | 68: High
A score of 2 indicates low satisfaction with work achievements, suggesting the person may feel their results are not meeting their expectations.
example score
2/8
Interest in Work (IiW)
Interest in Work measures how engaged and positively oriented a person feels toward the work they do.
Low interest
Moderate interest
High interest
02: Low interest | 35: Moderate interest | 68: High interest
A score of 2 indicates low interest in the work, suggesting limited engagement and enjoyment in day-to-day tasks.
example score
4/8
Work Preference (WP)
This scale measures the extent to which a person values meaningful work over higher earnings.
Earnings-first
Balanced
Meaning-first
02: Earnings-first | 35: Balanced | 68: Meaning-first
A score of 4 suggests a balanced preference, with meaning in work and earnings seen as similarly important.
example score
5/8
Level of Aspiration (LoA)
Measures the degree of ambition and drive to achieve higher results in professional activity.
Low aspiration
Moderate aspiration
High aspiration
02: Low aspiration | 35: Moderate aspiration | 68: High aspiration
A score of 5 indicates a moderate level of aspiration, suggesting a generally steady desire to achieve more without a strong push for maximal advancement.
example score
2/8
Professional Responsibility (PR)
Professional responsibility reflects how conscientiously a person approaches fulfilling work duties and adhering to commitments.
Low
Moderate
High
02: Low | 35: Moderate | 68: High
A score of 2 suggests a low level of professional responsibility, with a tendency toward less consistent attention to duties and follow-through.
example score
77/100
Overall Job Satisfaction (OJS)
Measures the overall, integrative level of a person's satisfaction and well-being in their work environment.
Low
Average
High
044: Low | 4555: Average | 56100: High
A score of 77 falls in the High range, indicating a generally strong sense of satisfaction with work and the team environment.
Start Online Test
just completed the test
DATA-BASED USER COHORTS

Who Usually Takes This Test?

Burnout and boredom seekers
41%OF USERS
People who feel drained, bored, or stuck at work take it to pinpoint what exactly is making their job unsatisfying.
Career change deciders
34%OF USERS
People considering a new role or industry use it to compare what they want from work with what they actually experience now.
Managers checking team morale
25%OF USERS
Leaders and HR specialists use it as a quick pulse check to spot issues with conditions, pay priorities, or relationships in a team.
BASED ON AGGREGATED, ANONYMIZED DATA FROM TENS OF THOUSANDS OF FREUDLY USERS.
Benchmarking

See How You Compare

Once you complete the test, your results are compared with real-world data from people in your country.
Below is a preview of how scores are typically distributed across each scale.
Satisfied with working conditions (Swwc)
Average
2.3
Normal range
13.6
min.
0
max.
8
This curve shows how scores are typically distributed.
Once you complete the test, your result will appear on the scale so you can see how you compare.
Satisfactory with management (Swm)
Average
5.9
Normal range
4.97
min.
0
max.
8
This curve shows how scores are typically distributed.
Once you complete the test, your result will appear on the scale so you can see how you compare.
Employee Satisfaction (ES)
Average
3.4
Normal range
2.24.7
min.
0
max.
8
This curve shows how scores are typically distributed.
Once you complete the test, your result will appear on the scale so you can see how you compare.
Satisfied with achievements (Swa)
Average
5.7
Normal range
4.27.2
min.
0
max.
8
This curve shows how scores are typically distributed.
Once you complete the test, your result will appear on the scale so you can see how you compare.
Interest in Work (IiW)
Average
3.1
Normal range
2.14.2
min.
0
max.
8
This curve shows how scores are typically distributed.
Once you complete the test, your result will appear on the scale so you can see how you compare.
Work Preference (WP)
Average
2.1
Normal range
1.13.1
min.
0
max.
8
This curve shows how scores are typically distributed.
Once you complete the test, your result will appear on the scale so you can see how you compare.
Level of aspiration (Loa)
Average
5.1
Normal range
3.76.4
min.
0
max.
8
This curve shows how scores are typically distributed.
Once you complete the test, your result will appear on the scale so you can see how you compare.
Professional Responsibility (PR)
Average
2.7
Normal range
1.44
min.
0
max.
8
This curve shows how scores are typically distributed.
Once you complete the test, your result will appear on the scale so you can see how you compare.
Overall Job Satisfaction (OJS)
Average
38
Normal range
23.152.9
min.
0
max.
100
This curve shows how scores are typically distributed.
Once you complete the test, your result will appear on the scale so you can see how you compare.
Featured On
SAMPLE QUESTIONS

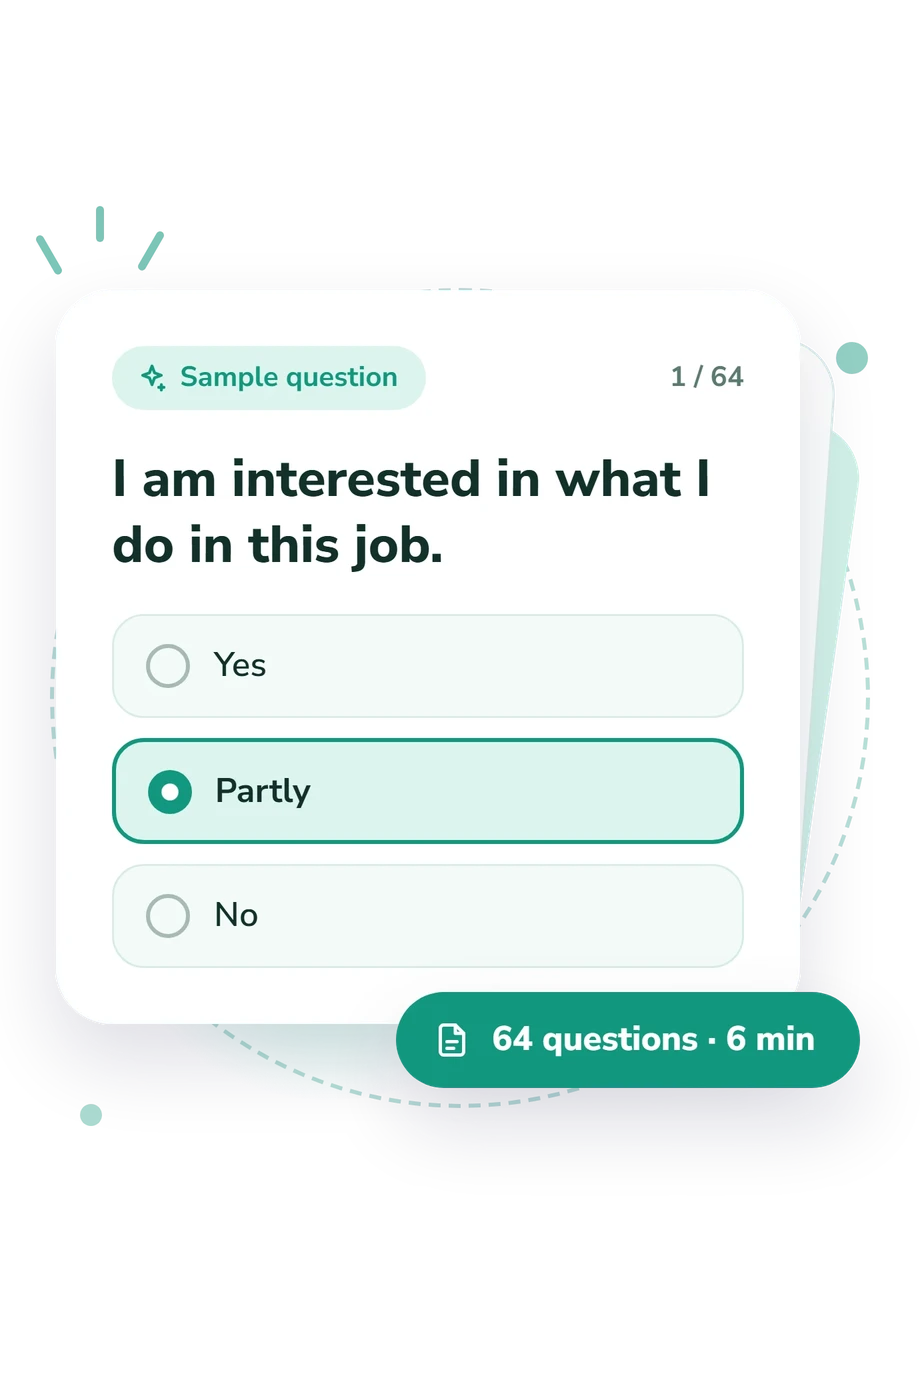
Example Questions From the Test

    • Yes
    • Partly
    • No
    • Yes
    • Partly true
    • No
    • Yes
    • Not with everyone
    • No
WHAT THE TEST MEASURES
About This Assessment
Integral job satisfaction Test

Overall Job Satisfaction Test - Symptoms and Signs

job satisfaction

This measure is used to obtain a brief self-report snapshot of work-related attitudes and perceived satisfaction across the individual’s job experience. Overall Job Satisfaction is typically administered in workplace, coaching, or applied research settings to support initial screening and discussion of factors that may be contributing to positive or negative work experiences.

The instrument includes 32 items and takes about 6 minutes to complete. Item content commonly samples multiple facets of the work experience (e.g., interest in tasks, sense of accomplishment, workplace relationships, perceived compensation, and working conditions) and is intended to support a broad, integrative summary of perceived satisfaction. Overall Job Satisfaction is attributed to Edwin A. Locke and should be interpreted in conjunction with contextual information, role demands, and other relevant assessment data rather than as a stand-alone diagnostic indicator.

Author: Edwin A. Locke
Literature: Spector, P. E. Measurement of human service staff satisfaction: Development of the Job Satisfaction Survey. American Journal of Community Psychology. 1985.
Popular tests
Comments
Leave a Comment