
Health Attitude Diagnostic Evaluation Test
How the Scales are Structured
Who Usually Takes This Test?
See How You Compare
Below is a preview of how scores are typically distributed across each scale.
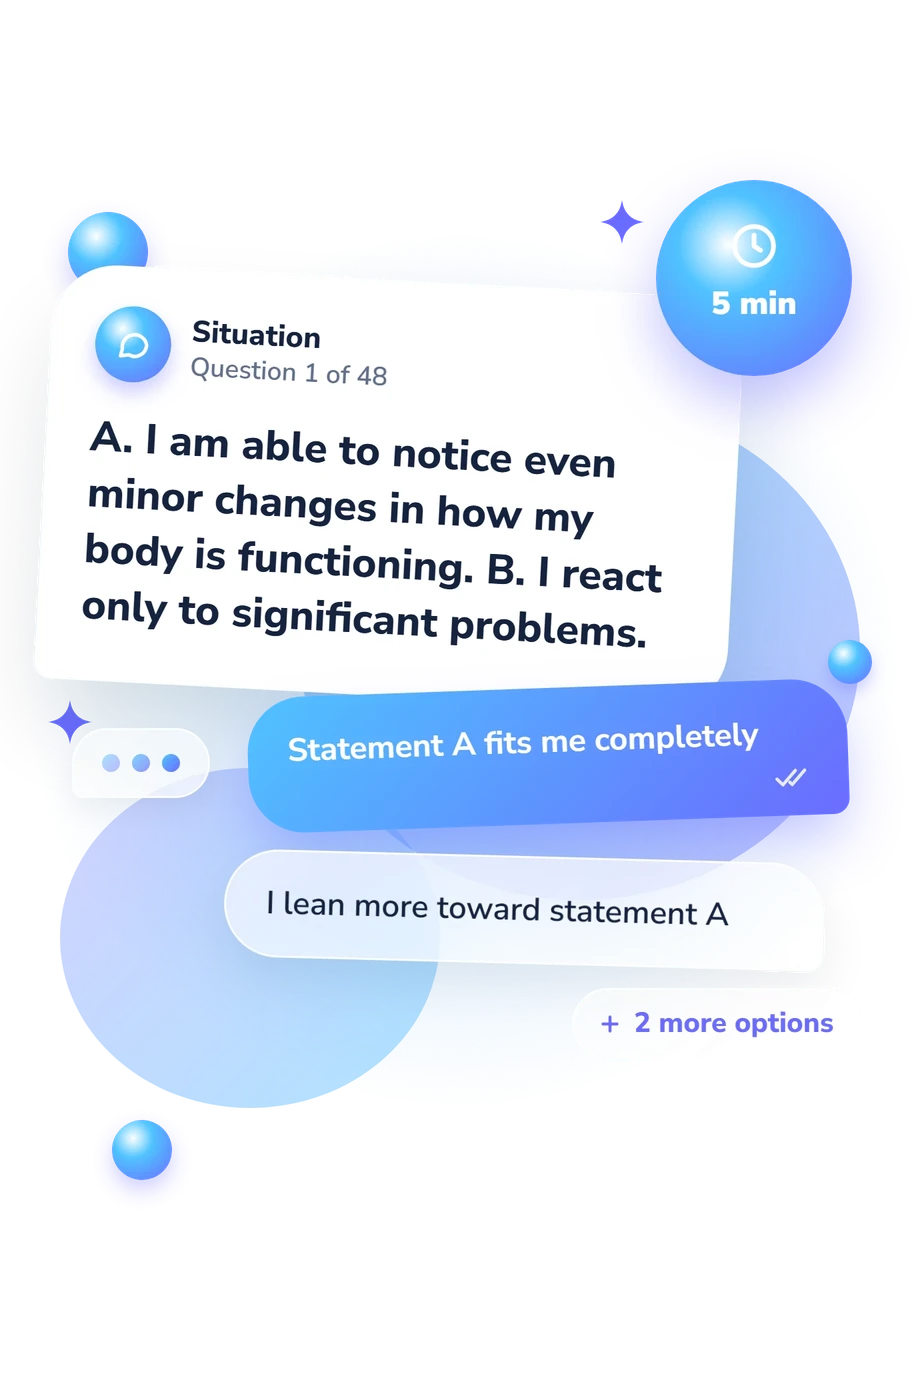
Example Questions From the Test
- Statement A fits me completely
- I lean more toward statement A
- I lean more toward statement B
- Statement B fits me completely
- Statement A fits me completely
- I lean more toward statement A
- I lean more toward statement B
- Statement B fits me completely
- Statement A fits me completely
- I lean more toward statement A
- I lean more toward statement B
- Statement B fits me completely
Health Attitude Diagnostic Evaluation Test - Description and methodology of the test
People who want a clearer picture of how they relate to health can use the Health Attitude Diagnostic Evaluation Test as a self-report profile. Rather than focusing only on symptoms or medical knowledge, this health attitude assessment considers how beliefs become feelings, daily choices, information seeking, and actions that may influence other people. The result helps a respondent notice stronger engagement and habits that deserve reflection.
What This Assessment Explores
The assessment treats health attitude as multidimensional. Paired situations address bodily awareness, prevention, wellness, self-care enjoyment, and influence on others. This health attitude questionnaire examines five dimensions:
- Behavioral Scale (0-9) shows actions influencing others, changing the health environment, and promoting a health-supportive lifestyle: Personal-only 0-3; Occasional influence 4-6; Active promoter 7-9.
- Practical Scale (0-9) shows health maintenance through sports, exercise, and wellness procedures: Low practical engagement 0-3; Moderate practical engagement 4-6; High practical engagement 7-9.
- Cognitive Scale (0-9) shows active interest, independent information seeking, and communication about health: Low 0-3; Moderate 4-6; High 7-9.
- Emotional Scale (0-9) shows enjoyment of health and absence of negative emotional stereotypes: Low engagement 0-3; Moderate engagement 4-6; High engagement 7-9.
- Health Attitude Index (0-9) shows overall development and positivity of health attitude: Low 0-3; Moderate 4-6; High 7-9.
Methodology and Evidence Base
Each item uses a paired-statement format. One option may describe greater attention, participation, or influence, while the other presents a more limited or different orientation. Four response positions show whether A or B fits completely or whether the respondent leans toward one, capturing degree rather than a simple yes-or-no answer.
The questionnaire reports results for the displayed scales, but its item-to-scale assignment, weighting, and point-conversion method are not specified. Individual answer values therefore should not be reverse-engineered. Read the health attitude profile by comparing the pattern across domains.
The published Health Attitude Index instrument by Deryabo and Yasvin (1999) is the source instrument to which this questionnaire is conceptually consistent; the online questionnaire is not presented as the same validated version. Polyakova and Bonkalo (2023) provide related evidence on self-assessed health-attitude patterns, not evidence about norms for this questionnaire. The displayed labels and ranges are the result bands shown by the questionnaire, so interpretation should remain within those supplied bands. Self-report results can shift with current circumstances, self-awareness, and the wish to present oneself favorably.
- Deryabo, S. D., & Yasvin, V. A. (1999). Index of attitudes towards health and a healthy lifestyle: A measurement technique. School Director, (2), 7-16.
- Polyakova, O. B., & Bonkalo, T. I. (2023). Features of self-assessment index of attitude toward personal health in young students. City Healthcare, 4(3), 4-12. 10.47619/2713-2617.zm.2023.v.4i3;4-12
Updated: