
Percentage Quiz
How the Scales are Structured
Who Usually Takes This Test?
See How You Compare
Below is a preview of how scores are typically distributed across each scale.
Example Questions From the Test
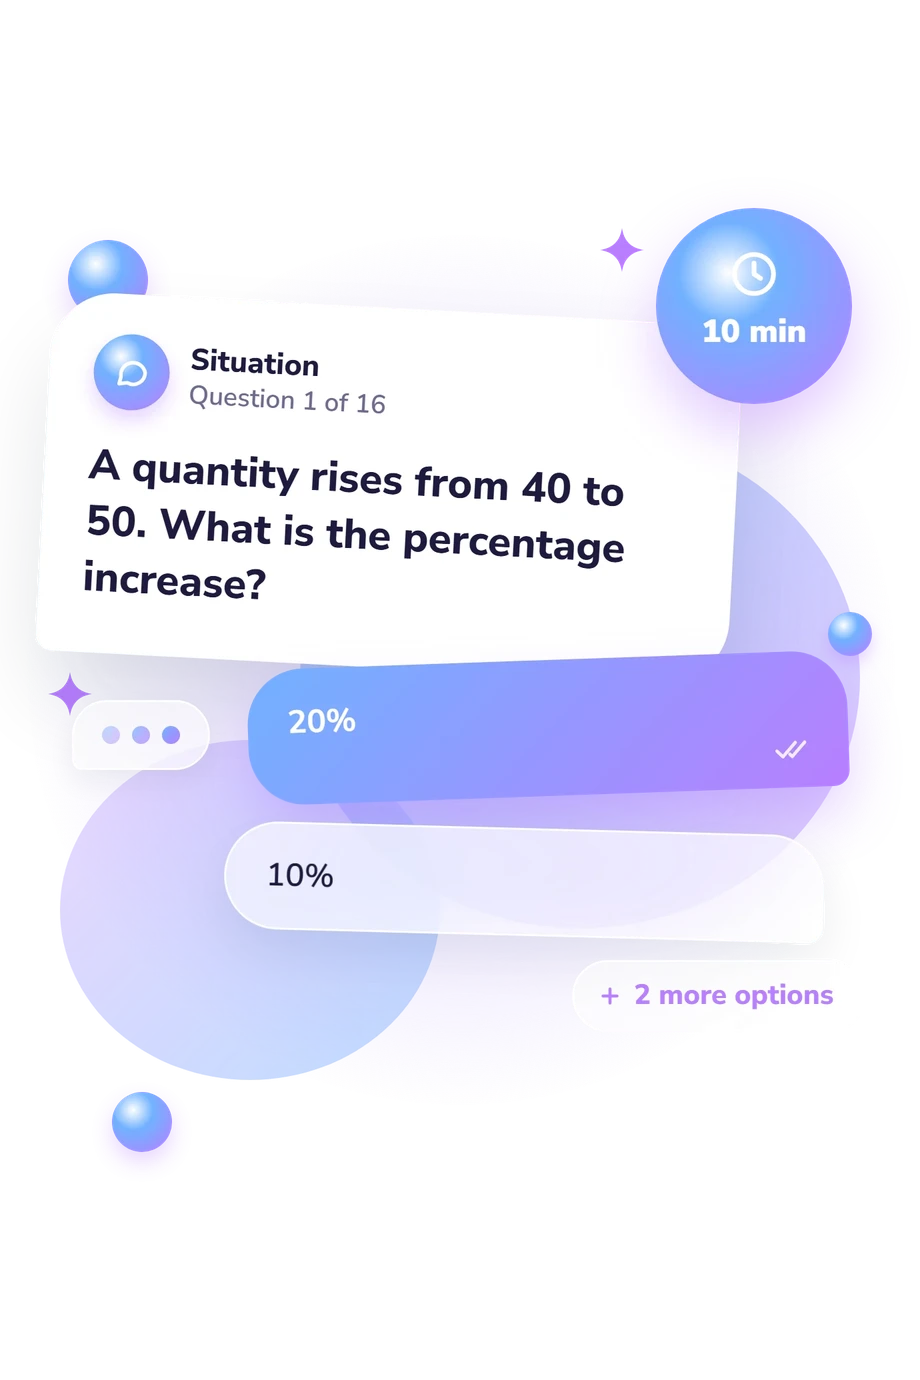
- 20%
- 10%
- 25%
- 40%
- 8
- 12
- 10
- 15
- 180
- 200
- 198
- 202
Percentage Quiz - Description and methodology of the test
For learners, shoppers, employees, and anyone who regularly works with prices or proportions, this percentage quiz offers a focused check of practical numerical understanding. It is useful when you want to see whether routine percentage reasoning is accurate or where a concept needs review. By linking classroom-style calculations with familiar decisions involving money, comparisons, and everyday quantities, the percent quiz makes practical numerical understanding easier to examine.
What This Assessment Measures
These items test whether a person can interpret percentages, choose the correct base, and apply a relationship to an amount rather than recall a formula. Learners and adults can use it as a percentage practice test when they want a practical snapshot of demonstrated percentage knowledge.
The main task groups are:
- Conversions show whether you can move among percentages, decimals, fractions, and quantities.
- Change problems measure work with increases, discounts, successive reductions, and percentage points.
- Applied items show how you handle reverse calculations, error, tax, tips, and comparisons.
Together, these tasks move from direct calculation to applied reasoning. Percentage Knowledge ranges from 0-16: Foundational (0-6), Developing (7-12), or Strong (13-16). Foundational suggests core review may help, Developing reflects competence with many routine problems, and Strong indicates reliable performance across direct and applied tasks.
Methodology and Evidence Base
Each item uses four-option multiple choice. The set mixes direct conversions with word problems and multi-step situations, including reverse calculations, percentage-point distinctions, sequential changes, and a stated-base error calculation. The result is a count of correct answers, so it reflects performance on this questionnaire rather than a weighted profile of separate traits.
Conceptually, its educational logic is consistent with Jacobs Danan and Gelman (2018), who discuss difficulties in percentage reasoning, Parker and Leinhardt (1995) on percent as a proportion, and Chen and Rao (2007) on errors caused by successive percentage changes. These sources support the reasoning sampled here; the questionnaire is not presented as an adaptation, replication, or independently validated version of those instruments or studies.
This percentage skills test provides an online self-check whose displayed band is based on the number of correct answers on this questionnaire. The result reflects accuracy across conversions, changes, reverse calculations, comparisons, and everyday financial applications. Notation familiarity, recent practice, and attention can affect results, so use the score with the particular topics you want to review.
- Jacobs Danan, Jennifer A., and Rochel Gelman. 2017. "The problem with percentages." Philosophical Transactions of the Royal Society B: Biological Sciences, 373(1740), 20160519. 10.1098/rstb.2016.0519
- Parker, Melanie, and Gaea Leinhardt. 1995. "Percent: A Privileged Proportion." Review of Educational Research, 65(4), 421-481. 10.3102/00346543065004421
- Chen, Haipeng, and Akshay R. Rao. 2007. "When Two Plus Two Is Not Equal to Four: Errors in Processing Multiple Percentage Changes." Journal of Consumer Research, 34(3), 327-340. 10.1086/518531
Updated: