
Guess My Height Quiz
How the Scales are Structured
Who Usually Takes This Test?
See How You Compare
Below is a preview of how scores are typically distributed across each scale.
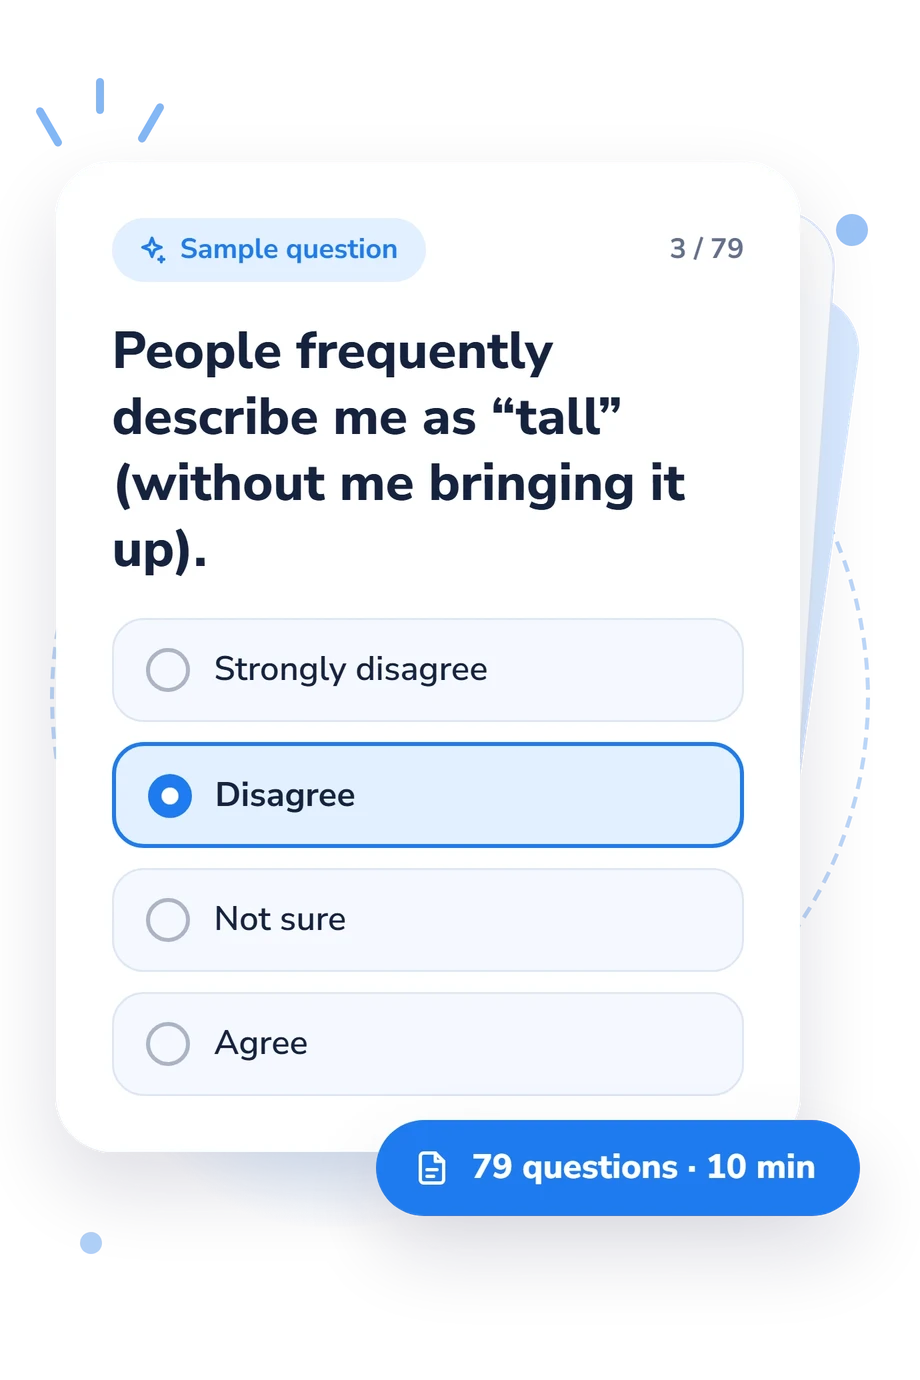
Example Questions From the Test
- Strongly disagree
- Disagree
- Not sure
- Agree
- Strongly disagree
- Disagree
- Not sure
- Agree
- Strongly disagree
- Disagree
- Not sure
- Agree
Guess My Height Quiz - Description and methodology of the test
For people curious how ordinary observations may point toward stature, this guess your height quiz turns comparisons into an estimate. The Guess My Height Quiz suits anyone who wants to examine clues rather than rely on a ruler. Its responses produce the estimate, while the result reports how consistent and height-informative they were and whether the error margin is narrow or broad. The result gives an estimate from everyday observations.
What This Assessment Explores
Rather than measuring body length, it uses indirect clues: family patterns, body proportions, shoe size, clothing fit, posture, reach, and familiar objects. It also asks whether those clues feel consistent or uncertain.
As a quiz that guesses your height from indirect clues, it turns these observations into a best guess and indicates how dependable the pattern appears.
The result has three parts:
- Confidence Score (0-100) reflects how consistent and height-informative the responses were: Low confidence 0-39, Moderate confidence 40-74, and High confidence 75-100.
- Estimated Height (cm) (120-220) gives the predicted height: Shorter estimate 120-159, Midrange estimate 160-189, and Taller estimate 190-220.
- Uncertainty Range (± cm) (0-20) shows error width: Tight range 0-6, Moderate range 7-13, and Wide range 14-20.
Together, these dimensions separate the estimate itself from the strength of the evidence behind it.
Methodology and Evidence Base
Four response options-Strongly disagree, Disagree, Not sure, and Agree-let the questionnaire guess your height from statements about your experience. The height prediction is combined with a confidence indicator and an uncertainty margin; the last shows how broad the estimate's error margin is.
Ozden et al. (2005) is a relevant comparison because it examined stature in relation to foot and shoe dimensions. Ibeabuchi et al. (2018) similarly reported stature-prediction equations from foot dimensions in a defined adult population. This questionnaire is conceptually consistent with those findings, but it is not an adaptation of either study and cannot inherit their population-specific equations.
Self-report also introduces uncertainty. Evans, Gray, and Reimondos (2023) found that reported height can vary in reliability over time, which matters when answers depend on memory, posture, clothing, or informal comparisons. Current context and self-awareness may therefore shift the pattern.
Because this is an entertainment-based online questionnaire, treat its result as an estimate rather than measured height; a tighter uncertainty range indicates a narrower error margin, while a wider one indicates less certainty.
- Hilmi Ozden, Yasemin Balci, Canan Demirustu, Akin Turgut, and Mehmet Ertugrul. Stature and sex estimate using foot and shoe dimensions. Forensic Science International, 147(2-3), 181-184, 2005. 10.1016/j.forsciint.2004.09.072
- Nwachukwu Mike Ibeabuchi, Emeka Ambrose Okubike, Olaleye Andrew Olabiyi, and Michael Ebe Nandi. Predictive equations and multiplication factors for stature estimation using foot dimensions of an adult Nigerian population. Egyptian Journal of Forensic Sciences, 8, 63, 2018. 10.1186/s41935-018-0094-2
- Ann Evans, Edith Gray, and Anna Reimondos. How tall am I again? A longitudinal analysis of the reliability of self-reported height. SSM - Population Health, 22, 101412, 2023. 10.1016/j.ssmph.2023.101412
Updated: