
Science Project Quiz
How the Scales are Structured
Who Usually Takes This Test?
See How You Compare
Below is a preview of how scores are typically distributed across each scale.
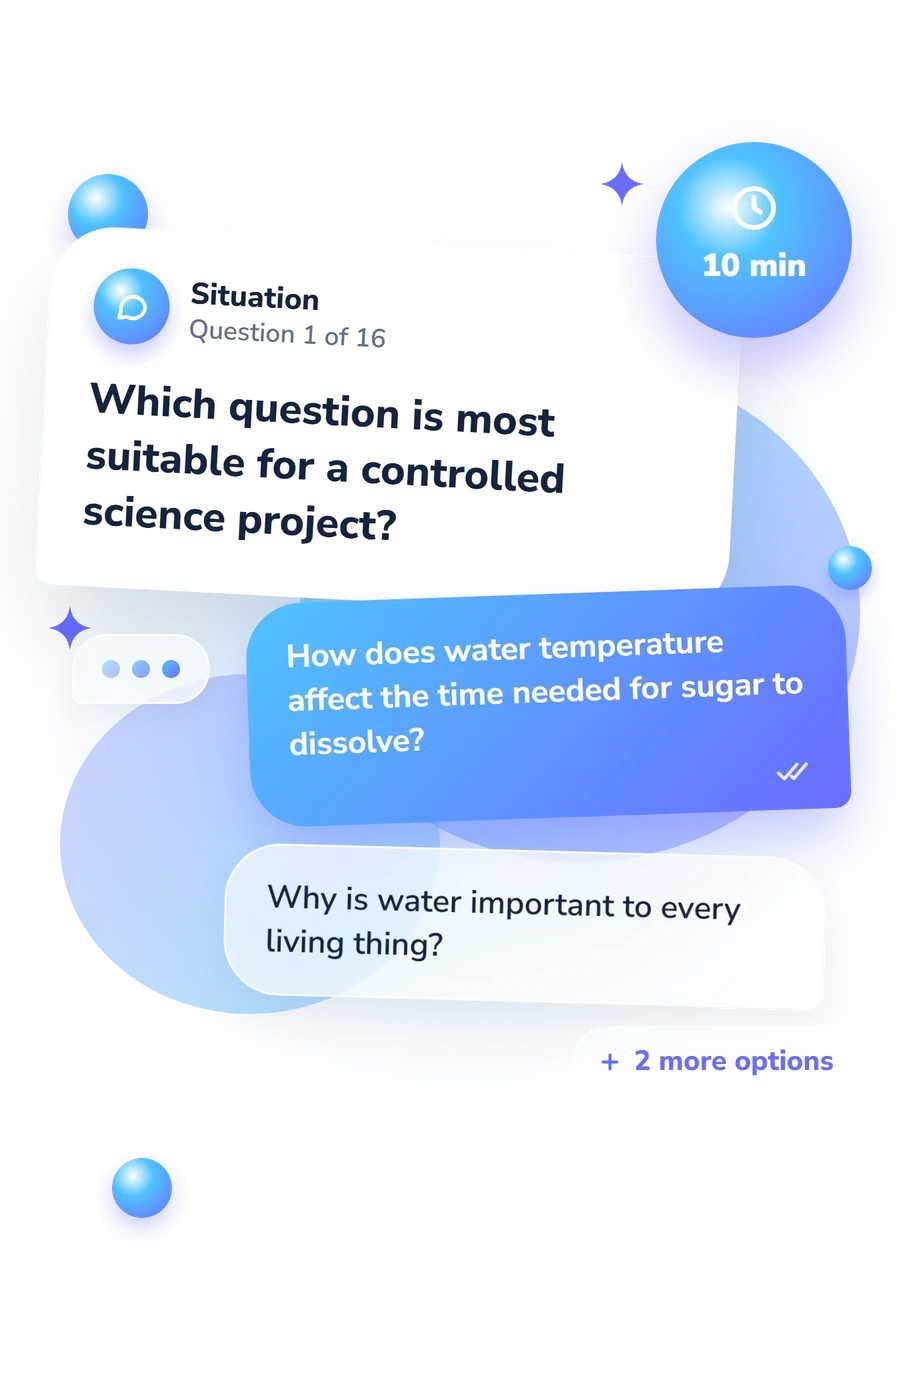
Example Questions From the Test
- Round the result to 4 meters and report it
- Compare it with the longest flight found online
- Repeat the flight several times under the same conditions
- Change the airplane design immediately
- In the graph title only
- On the horizontal x-axis because it was measured last
- On the vertical y-axis because it is the dependent variable
- In the legend because it changed during the project
- The distance traveled by the car
- The toy car used in every trial
- The surface on which distance is measured
- The height of the ramp
Science Project Quiz - Description and methodology of the test
Students choosing science project ideas or learning to plan a fair investigation can use this assessment to check whether their scientific reasoning is ready for the next step. The questions turn common project decisions into practical multiple-choice problems and show why a workable topic needs a testable question and manageable method. The science project quiz gives learners a focused way to examine that foundation before developing a project.
What This Assessment Measures
Rather than rating an idea's excitement, the assessment checks whether a learner can turn curiosity into a controlled investigation. It covers hypotheses, variables, fair comparisons, data, safety, sources, and evidence-based conclusions. Its questions cover these areas, while one result reflects overall science-project knowledge and suggests broad review topics.
The items cover these foundations:
- Hypotheses and questions show whether an idea is testable.
- Variables and fair tests show what changes, what is measured, and what stays constant.
- Evidence and measurement show whether data, variation, and errors are handled sensibly.
- Communication and safety show whether procedures, sources, precautions, and conclusions are responsibly reported.
The single scale is Science Project Knowledge: 0-16. Emerging Foundation (0-6) reflects concepts needing review; Developing Knowledge (7-12) reflects many essentials; Strong Knowledge (13-16) reflects a well-rounded command of designing, evaluating, and communicating projects. It highlights priorities for science project planning.
Methodology and Evidence Base
Each item presents a short project scenario or principle with four answer choices. Selecting the best option tests applied reasoning about hypotheses, controls, variables, repeated trials, outliers, safety, and conclusions rather than simple definition recall.
The main evidence anchor is the experimental-design inventory developed by Deane and colleagues. This questionnaire is conceptually consistent with that instrument’s focus on experimental design concepts, but it is not a direct adaptation. A related rubric by Dasgupta and colleagues adds a diagnostic lens for variable manipulation, outcome measurement, variability, and the scope of inference. The National Research Council framework supports the emphasis on planning investigations, analyzing data, constructing explanations, and communicating information.
The questionnaire displays one overall result interpreted through the catalogue’s three bands rather than separate subscales. That overall result can guide science fair project planning review, while the item themes indicate broad concepts that may deserve attention. Because the score has no stated population norms or reliability estimate, it should be read as an online indicator of overall knowledge rather than evidence of consistent real-world procedural performance.
- Deane, Thomas, Kathy Nomme, Erica Jeffery, Carol Pollock, and Gülnur Birol. “Development of the Biological Experimental Design Concept Inventory (BEDCI).” CBE-Life Sciences Education, 13(3), 2014, 540-551. 10.1187/cbe.13-11-0218
- Dasgupta, Annwesa P., Trevor R. Anderson, and Nancy Pelaez. “Development and Validation of a Rubric for Diagnosing Students’ Experimental Design Knowledge and Difficulties.” CBE-Life Sciences Education, 13(2), 2014, 265-284. 10.1187/cbe.13-09-0192
- National Research Council. A Framework for K-12 Science Education: Practices, Crosscutting Concepts, and Core Ideas. Washington, DC: The National Academies Press, 2012. 10.17226/13165
Updated: