
Our Survey Said Quiz
How the Scales are Structured
Who Usually Takes This Test?
See How You Compare
Below is a preview of how scores are typically distributed across each scale.
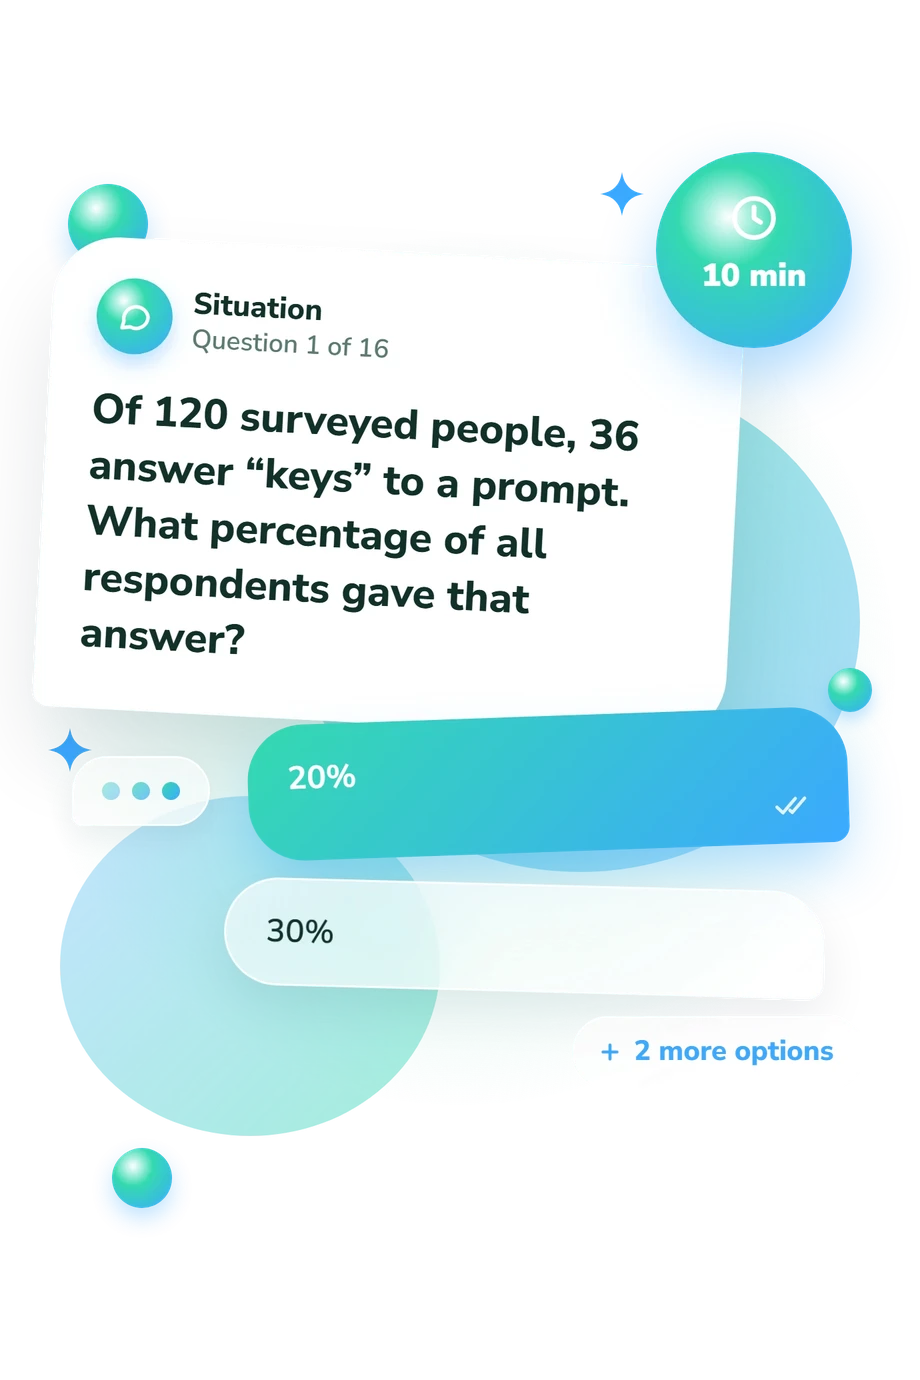
Example Questions From the Test
- 20%
- 30%
- 36%
- 25%
- 25
- 100
- 75
- 50
- Choose what you expect many surveyed people to say first
- Choose the answer that is most personally meaningful to you
- Choose the rarest answer that still fits the wording
- Choose the answer requiring the most specialist knowledge
Our Survey Said Quiz - Description and methodology of the test
For readers who enjoy reasoning from everyday answers rather than relying on personal preference, this questionnaire turns familiar game-show-style prompts into a structured knowledge check. The Our Survey Said Quiz is useful for anyone who wants to examine how accurately they read response counts, sampling context, and coded categories. Its survey logic questions connect quick decisions with the principles behind popular-answer boards.
What This Assessment Explores
This assessment measures practical understanding of how survey-board results are produced and interpreted. It suits readers who want to distinguish a likely group response from an answer that is merely familiar or defensible. The overall result describes survey board knowledge across these skills, without separating strengths, weaknesses, or areas needing practice.
The main abilities are:
- Survey-board matching shows whether you choose the response most likely to be common among respondents.
- Sampling and calculation show whether you can account for respondent groups, counts, percentages, ties, and leftover answers.
- Coding and interpretation show whether you can combine synonymous responses and describe the board accurately.
The displayed scale is Our Survey Said Knowledge, scored from 0-16. Foundational (0-6) indicates basic understanding; Developing (7-12) indicates mostly accurate interpretation; Strong (13-16) indicates clear command of survey-board answers, response coding, samples, and result interpretation.
Methodology and Scientific Basis
Each item uses four-option multiple choice. The respondent selects the answer that best fits the survey evidence, rather than one that is merely plausible. Tasks include finding the highest count, calculating a percentage, comparing samples, recognizing ties, combining synonymous labels, and interpreting answers outside the displayed categories. The displayed total summarizes performance across these connected skills, not a personality preference.
The evidence base is conceptually consistent with the Family Feud matching task (Bucci & Tenorio, 2010), which supports distinguishing a popular group response from an individual's own answer. This questionnaire is not presented as an adaptation of that study. Giorgetti and Sebastiani (2003) provide a relevant model for automated survey coding, especially grouping synonymous responses, while Bradburn, Sudman, and Wansink (2004) support attention to wording, sampling, and response interpretation.
Viewed as a survey knowledge test, the result is a descriptive summary of performance on these items. Scores can vary with current context, game-show familiarity, attention, calculation confidence, self-reporting, and interpretation of each prompt, so read it as performance on this format rather than a broad measure of reasoning.
- Bucci, Gabriella A., and Rafael A. Tenorio. (2010). Group diversity and salience: A natural experiment from a television game show. Journal of Socio-Economics, 39(2), 306-315. 10.1016/j.socec.2009.10.006
- Giorgetti, Daniela, and Fabrizio Sebastiani. (2003). Automating survey coding by multiclass text categorization techniques. Journal of the American Society for Information Science and Technology, 54(14), 1269-1277. 10.1002/asi.10335
- Bradburn, Norman M., Seymour Sudman, and Brian Wansink. (2004). Asking Questions: The Definitive Guide to Questionnaire Design-for Market Research, Political Polls, and Social and Health Questionnaires (2nd ed.). Jossey-Bass.
Updated: