
Math Quiz
How the Scales are Structured
Who Usually Takes This Test?
See How You Compare
Below is a preview of how scores are typically distributed across each scale.
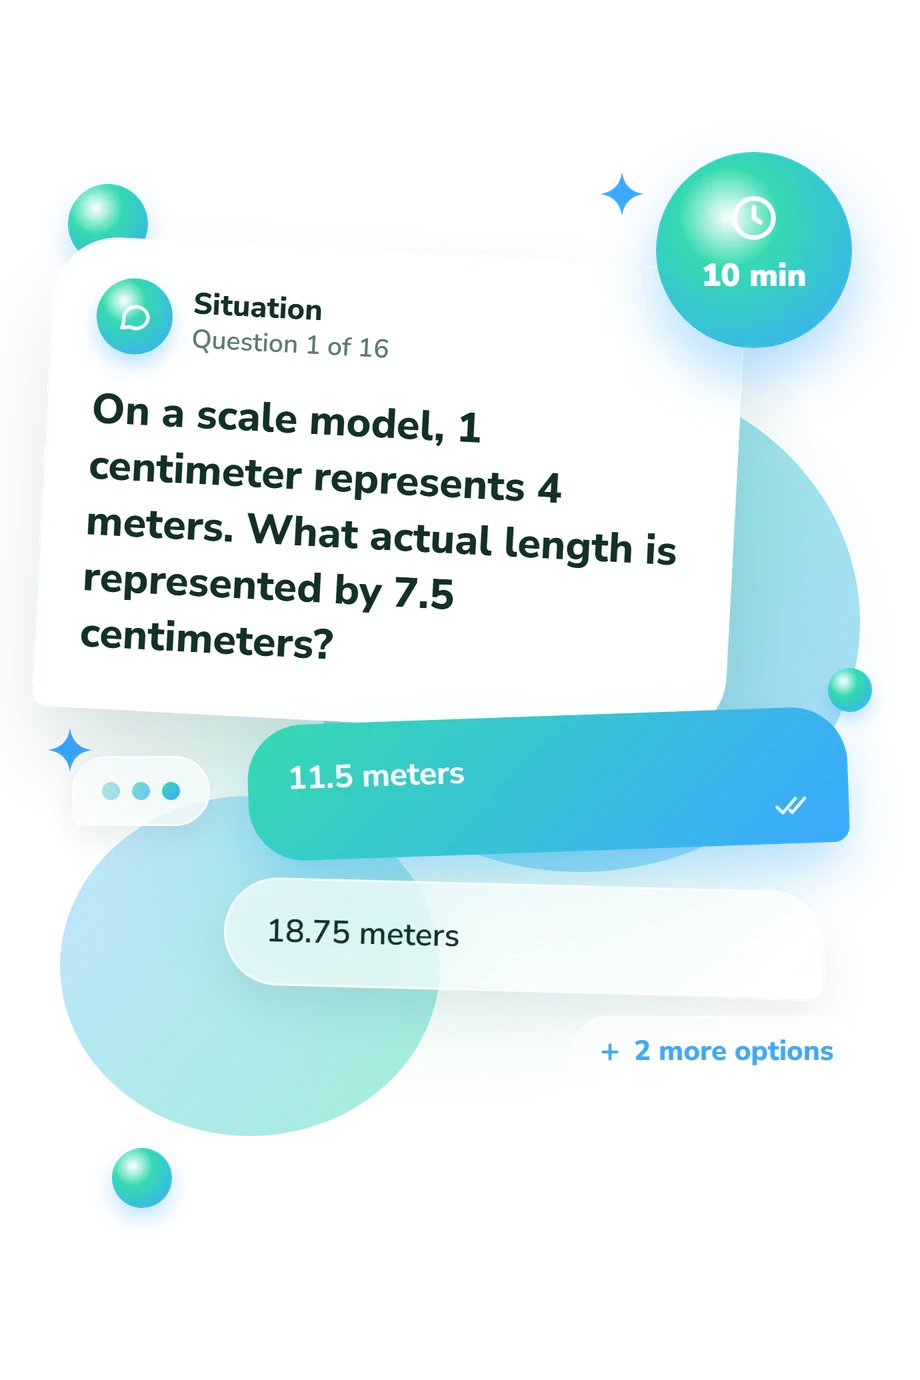
Example Questions From the Test
- 5 meters
- 75 meters
- 30 meters
- 300 meters
- 5/7
- 5/12
- 17/12
- 7/12
- 12%
- 115%
- 85%
- 15%
Math Quiz - Description and methodology of the test
People who want to check how comfortably they use common mathematical ideas can use this math quiz as a focused starting point. It is intended for learners, parents, or educators who want a concise view of performance across familiar school-related topics. As a mathematics quiz, it can show which areas feel secure and where deliberate practice may be useful, without turning the outcome into a placement decision.
What This Assessment Measures
The items sample operations, fractions, percentages, ratios, averages, scale, geometry, algebra, sequences, slope, proportional reasoning, and probability through short numerical or real-world situations.
The result offers a broad snapshot for anyone using the activity as a general mathematics quiz. It describes this sample, not a school year or the cause of an incorrect answer.
The displayed scale and bands are:
- Math Knowledge (0-16) summarizes accuracy across the sampled problems.
- Foundations to revisit (0-6) points to reviewing core operations, fractions, algebra, and measurement.
- Developing command (7-12) reflects success with several concepts and room to strengthen accuracy or multi-step application.
- Strong command (13-16) reflects broad, consistent knowledge across the topics sampled.
These labels can organize practice priorities, but they remain a summary of the question set rather than a comprehensive measure of mathematical ability.
Methodology and Evidence Base
Each item presents four answer options and asks the respondent to choose the response that best solves a numerical, geometric, algebraic, statistical, or probability problem. For learners, the math test quiz format keeps each task focused on selecting and applying a method. The displayed result condenses performance across the set; the displayed bands should not be treated as grade-level norms.
The content is conceptually consistent with the PISA 2022 mathematics framework (OECD, 2023), especially its attention to quantity, relationships, space, and uncertainty. It is not an adaptation of that framework. The questionnaire also connects with the strands described by Kilpatrick, Swafford, and Findell (2001): conceptual understanding, procedural fluency, strategic competence, adaptive reasoning, and productive disposition.
Nortvedt and Buchholtz (2018) emphasize the importance of context, methodology, and equity when interpreting mathematics assessment. Here, concentration, familiarity with similar formats, current practice, and testing conditions may influence performance. Because the item sample is limited, the result cannot represent every aspect of mathematical competence; use it to choose review topics and guide self-reflection.
- OECD. (2023). PISA 2022 Assessment and Analytical Framework. Paris: OECD Publishing. DOI 10.1787/dfe0bf9c-en
- Kilpatrick, Jeremy, Swafford, Jane, & Findell, Bradford (Eds.). (2001). Adding It Up: Helping Children Learn Mathematics. Washington, DC: National Academy Press. DOI 10.17226/9822
- Nortvedt, Guri A., & Buchholtz, Nils. (2018). Assessment in mathematics education: responding to issues regarding methodology, policy, and equity. ZDM-Mathematics Education, 50, 555-570. DOI 10.1007/s11858-018-0963-z
Updated: