
Subjective Loneliness Scale Test
How the Scales are Structured
Who Usually Takes This Test?
See How You Compare
Below is a preview of how scores are typically distributed across each scale.
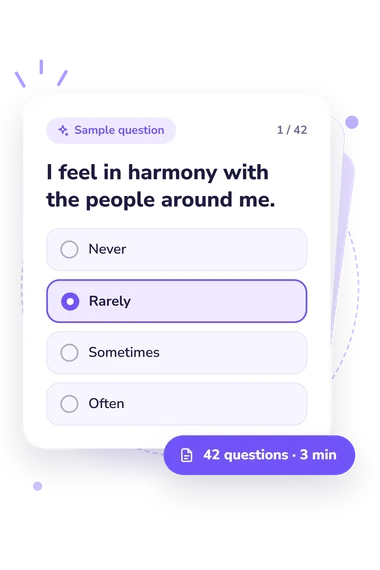
Example Questions From the Test
- Never
- Rarely
- Sometimes
- Often
- Never
- Rarely
- Sometimes
- Often
- Never
- Rarely
- Sometimes
- Often
Subjective Loneliness Scale Test - Description and methodology of the test
People who want to understand a gap between being surrounded by others and feeling emotionally alone may find this Subjective Loneliness Scale Test useful. It is designed for readers who can reflect on everyday relationships, support, and belonging. This subjective loneliness assessment describes perceived social connection, giving a focused result for personal reflection on belonging, support, and emotional closeness.
What This Assessment Explores
Loneliness is treated here as a subjective experience, not simply the number of people nearby. The statements ask whether you feel understood, supported, emotionally connected, and able to share thoughts openly. They also address missing common interests, abandonment, isolation, and family life.
For many readers, this loneliness questionnaire can clarify the difference between physical solitude and emotional disconnection. It suits people reflecting on relationships, belonging, or unmet needs for closeness, without assuming that any answer defines personality.
The result uses one scale, Loneliness and Social Isolation (0-63), assessing subjective loneliness and the degree of social isolation. Its displayed bands are:
- Low (0-22) indicates stronger social integration and less pronounced loneliness.
- Moderate (23-43) indicates an intermediate level of perceived disconnection or limited contact.
- High (44-63) indicates more pronounced loneliness and fewer social contacts.
These bands provide a current snapshot for self-reflection.
Methodology and Scientific Basis
Responses use four ordered options-Never, Rarely, Sometimes, and Often. The statements cover experiences of harmony, support, and shared interests as well as abandonment, isolation, or having no one to confide in. This mix asks the respondent to consider both available connection and its felt absence.
The result is reported on the displayed scale and interpreted through its displayed bands. As a social isolation test, this questionnaire is a self-report: current mood, recent changes in relationships, living circumstances, and willingness to answer candidly may affect the result. A recent conflict, move, or change in contact may therefore make perceived isolation feel different from one period to another.
The published UCLA Loneliness Scale, Version 3, offers a relevant conceptual comparison, not the source of this exact questionnaire. The 1978 development study by Russell, Peplau, and Ferguson is the closest source for its naming and focus, while later work by Russell, Peplau, and Cutrona provides validity context. This 21-item digital self-report questionnaire uses the displayed bands; published UCLA standardization, norms, and validation do not establish those properties for it.
- Russell, D. W. (1996). UCLA Loneliness Scale (Version 3): Reliability, validity, and factor structure. Journal of Personality Assessment, 66(1), 20-40. 10.1207/s15327752jpa6601_2
- Russell, D., Peplau, L. A., and Cutrona, C. E. (1980). The revised UCLA loneliness scale: Concurrent and discriminant validity evidence. Journal of Personality and Social Psychology, 39(3), 472-480. 10.1037/0022-3514.39.3.472
- Russell, D., Peplau, L. A., and Ferguson, M. L. (1978). Developing a measure of loneliness. Journal of Personality Assessment, 42(3), 290-294. 10.1207/s15327752jpa4203_11