
Freudly+971 508685814hello@freudly.ai
Freudly
security

Safety Attitudes Questionnaire (SAQ) Test
Take the online Safety Attitudes Questionnaire (SAQ) Test - AI psychologist FreudlyYou can take Safety Attitudes Questionnaire (SAQ) Testhere. Online version of a simple and accurate psychological test with interpretation.en
Understand your team’s patient safety climate and attitudes in about 8 minutes. Get clear, actionable insights to strengthen teamwork, communication, and safety practices across your unit.
Start Online Test
Questions: 418 minutes
08:30
October 2, 2025
October 2, 2025
Material has been updated
October 2, 2025
Material has been published
23,658 views
2,327 completions
1,990 likes
Verified by Daniel Hall
Psychologist with 25 years of experience
Share
Scale Explorer

How the Scales are Structured

example score
56/205
Safety Attitudes (SA)
Measures staff’s overall perception of and commitment to patient safety principles and safety culture within the organization.
Needs improvement
Developing
Strong
4195: Needs improvement | 96150: Developing | 151205: Strong
A score of 56 falls in the “Needs improvement” range, indicating a generally less positive safety attitude and potential gaps in perceived safety culture and adherence to safety principles.
example score
25/30
Teamwork Climate (TC)
Assesses the degree of support, collaboration, and mutual assistance within the team.
Needs improvement
Adequate
Strong
616: Needs improvement | 1723: Adequate | 2430: Strong
A score of 25 falls in the Strong range, suggesting a generally cohesive team climate with effective cooperation and mutual support.
example score
21/35
Safety Climate (SC)
Assesses how positively staff perceive workplace safety, including trust in safety measures and procedures.
Low
Moderate
High
716: Low | 1725: Moderate | 2635: High
A score of 21 falls in the Moderate range, suggesting mixed perceptions of workplace safety and only partial confidence in current safety practices.
example score
11/25
Job Satisfaction (JS)
Measures how satisfied employees are with their job, working conditions, and professional fulfillment.
Low
Moderate
High
512: Low | 1319: Moderate | 2025: High
A score of 11 falls in the Low range, indicating comparatively reduced job satisfaction and less positive perceptions of work and working conditions.
example score
15/20
Stress Recognition (SR)
Measures how well staff recognize the impact of stress on their work and regulate it in day-to-day clinical practice.
Low
Moderate
High
49: Low | 1015: Moderate | 1620: High
A score of 15 falls in the Moderate range, suggesting a generally adequate ability to notice stress effects and use basic strategies to manage them, with room to strengthen consistency under pressure.
example score
13/25
Perceptions of Unit Management (PoUM)
Measures staff perceptions of how supportive and competent department management is regarding patient safety.
Low confidence
Mixed confidence
High confidence
514: Low confidence | 1519: Mixed confidence | 2025: High confidence
A score of 13 falls in the Low confidence range, suggesting limited perceived support and involvement of department management in safety issues.
example score
13/25
Perceptions of Hospital Management (PoHM)
Measures how positively staff perceive clinic management decisions and policies related to maintaining patient safety.
Low
Moderate
High
511: Low | 1218: Moderate | 1925: High
A score of 13 falls in the Moderate range, suggesting a mixed but generally acceptable view of management’s safety-related actions with room for improvement.
example score
16/20
Working Conditions (WC)
Assesses staff satisfaction with working conditions, including equipment adequacy, comfort, and workplace safety.
Needs improvement
Adequate
Strong
410: Needs improvement | 1115: Adequate | 1620: Strong
A score of 16 falls in the Strong range, indicating generally positive perceptions of equipment, comfort, and workplace safety conditions.
Start Online Test
just completed the test
DATA-BASED USER COHORTS

Who Usually Takes This Test?

Hospital and clinic managers
41%OF USERS
Leaders and quality managers use it to gauge the safety culture, spot weak points in processes, and prioritize improvements.
Doctors and nurses
36%OF USERS
Clinical staff take it to share how safe and supported they feel at work and where teamwork or communication breaks down.
Patient safety specialists
23%OF USERS
Risk, compliance, and safety officers use it to monitor safety climate over time and evaluate the impact of training or policy changes.
BASED ON AGGREGATED, ANONYMIZED DATA FROM TENS OF THOUSANDS OF FREUDLY USERS.
Benchmarking

See How You Compare

Once you complete the test, your results are compared with real-world data from people in your country.
Below is a preview of how scores are typically distributed across each scale.
Attitude Towards Safety (ATS)
Average
145
Normal range
122.5167.5
min.
41
max.
205
This curve shows how scores are typically distributed.
Once you complete the test, your result will appear on the scale so you can see how you compare.
Teamwork Atmosphere (TA)
Average
16.4
Normal range
12.420.4
min.
6
max.
30
This curve shows how scores are typically distributed.
Once you complete the test, your result will appear on the scale so you can see how you compare.
Atmosphere of Safety (AoS)
Average
21.7
Normal range
17.326
min.
7
max.
35
This curve shows how scores are typically distributed.
Once you complete the test, your result will appear on the scale so you can see how you compare.
Job Satisfaction (JS)
Average
18.6
Normal range
15.122.1
min.
5
max.
25
This curve shows how scores are typically distributed.
Once you complete the test, your result will appear on the scale so you can see how you compare.
Stress Recognition (SR)
Average
11
Normal range
8.114
min.
4
max.
20
This curve shows how scores are typically distributed.
Once you complete the test, your result will appear on the scale so you can see how you compare.
Perception of department management (Podm)
Average
11.7
Normal range
815.5
min.
5
max.
25
This curve shows how scores are typically distributed.
Once you complete the test, your result will appear on the scale so you can see how you compare.
Perception of Clinic Management (PoCM)
Average
17
Normal range
14.519.5
min.
5
max.
25
This curve shows how scores are typically distributed.
Once you complete the test, your result will appear on the scale so you can see how you compare.
Working Conditions (WC)
Average
12.9
Normal range
1015.8
min.
4
max.
20
This curve shows how scores are typically distributed.
Once you complete the test, your result will appear on the scale so you can see how you compare.
Featured On
SAMPLE QUESTIONS

Example Questions From the Test

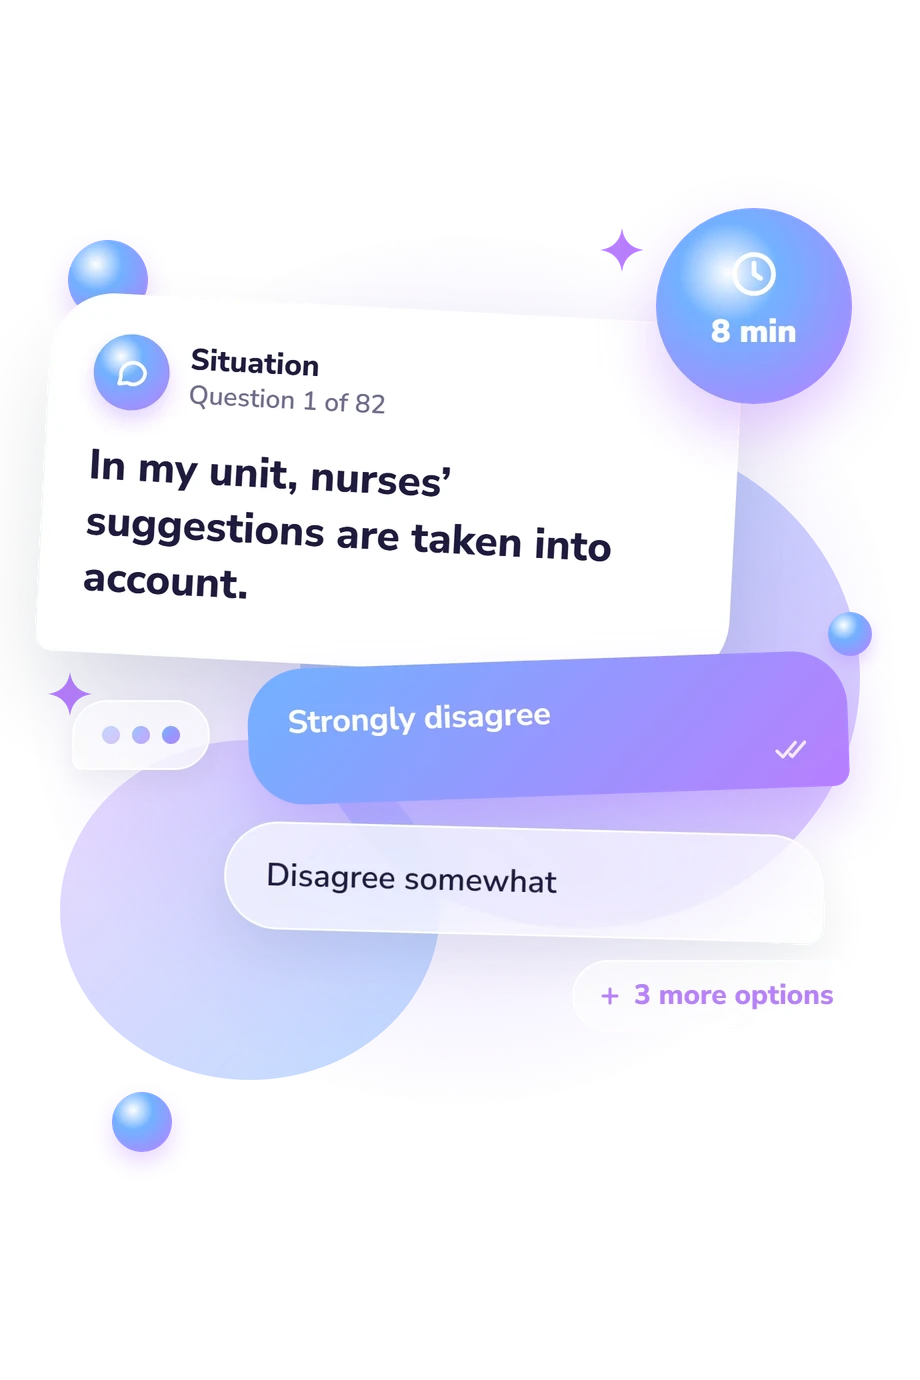
You are presented with a set of questions, each with multiple response options. Select the option you prefer based on your work experience in the unit where you spend most of your working time at the time of completing this questionnaire. When choosing a response option, rely on your first impression. For the purposes of this questionnaire, “unit supervisor” refers to: for nursing staff, the charge nurse; for physicians, the unit head; and for non-clinical staff, the department manager. For the purposes of this questionnaire, “clinic leadership” refers to: the chief medical officer, deputy chief medical officers, the chief nursing officer, and similar positions.
    • Strongly disagree
    • Disagree somewhat
    • Neutral
    • Agree somewhat
    • Strongly agree
    • Strongly disagree
    • Disagree somewhat
    • Neutral
    • Agree somewhat
    • Strongly agree
    • Strongly disagree
    • Disagree
    • Neither agree nor disagree
    • Agree
    • Strongly agree
WHAT THE TEST MEASURES
About This Assessment
Attitude Towards Safety, SAQ Test

Safety Attitudes Questionnaire (SAQ) Test - Symptoms and Signs

security
medical staff

This measure is used to assess staff perceptions of safety-related climate and teamwork within health care settings. The Safety Attitudes Questionnaire (SAQ) provides a structured way to identify strengths and areas for improvement in organizational attitudes linked to patient safety.

It consists of 41 items and typically takes about 8 minutes to complete. Items are presented as statements rated by respondents to characterize aspects of safety culture, including communication practices and perceived support for safe care. The Safety Attitudes Questionnaire (SAQ) is commonly used for quality improvement efforts, such as tracking change over time and informing targeted interventions. Original development is attributed to John B. Sexton and Robert L. Helmreich.

Author: John B. Sexton, Robert L. Helmreich
Literature: Edmondson, A. C. Psychological safety and learning behavior in work teams. Administrative Science Quarterly. 1999.; Flin, R., Burns, C., Mearns, K., Yule, S., & Robertson, E. Measuring safety climate in health care. Quality & Safety in Health Care. 2006.; Sexton, J. B., Helmreich, R. L., Neilands, T. B., Rowan, K., Vella, K., Boyden, J., Roberts, P. R., & Thomas, E. J. The Safety Attitudes Questionnaire: psychometric properties, benchmarking data, and emerging research. BMC Health Services Research. 2006.
Popular tests
Comments
Leave a Comment