
Fordyce Emotional Test
How the Scales are Structured
Who Usually Takes This Test?
See How You Compare
Below is a preview of how scores are typically distributed across each scale.
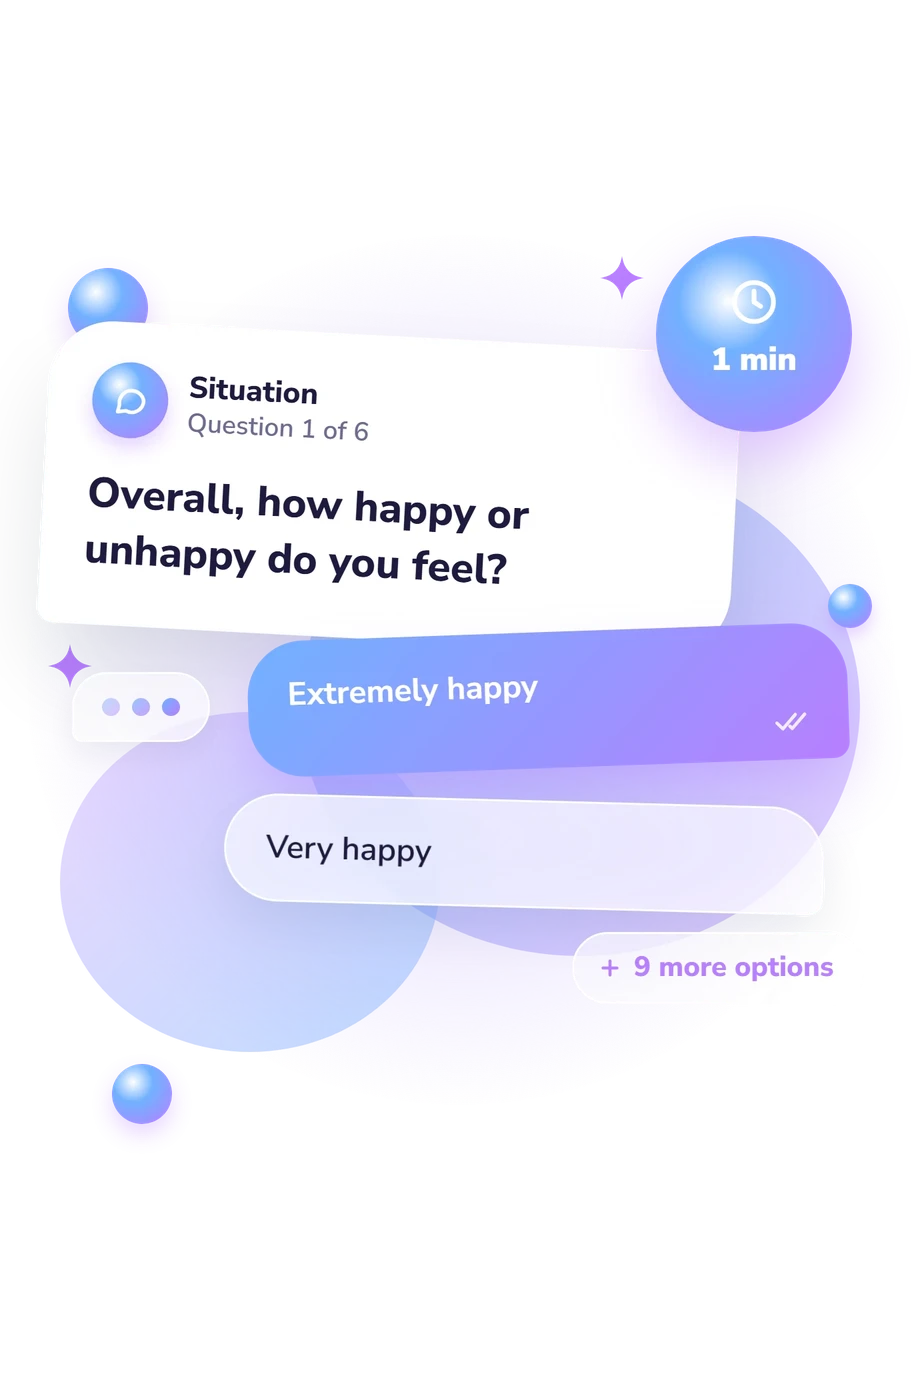
Example Questions From the Test
- Extremely happy
- Very happy
- Quite happy
- About halfway between happy and unhappy
- Sometimes happy
- Neutral (neither happy nor unhappy)
- Slightly unhappy (just below neutral)
- Rather unhappy (life feels a bit bleak)
- Fairly unhappy (I feel mildly depressed)
- Deeply unhappy (depressed, downhearted)
- Extremely unhappy (severe depression is with me constantly)
- About what percentage of the time (on average) do you feel upbeat?
- About what percentage of the time do you feel unhappy?
- About what percentage of the time do you usually feel neutral?
- Happy
- Unhappy
- Neither happy nor unhappy
Fordyce Emotional Test - Description and methodology of the test
People who want to understand their everyday emotional balance can use the Fordyce Emotional Test as a structured self-reflection exercise. The questionnaire connects a broad happiness judgment with estimates of time spent feeling upbeat, unhappy, or neutral. This emotional balance test can help readers notice whether positive, negative, or neither states dominate their reported experience.
What This Assessment Explores
The test maps time into a happiness profile.
These dimensions are:
- Happy (0-100) reflects happy-time percentage and life satisfaction: Lower happiness 0-55; Higher happiness 55.1-100.
- Unhappy-average unhappy time (0-100) measures unhappy-time percentage: Low 0-15.1; High 15.2-100.
- Unhappy-negative-emotion time (0-100) reflects unhappy or negative-emotion time: Low 0-16.7; Elevated 16.8-100.
- Neutral (0-100) measures neither-positive-nor-negative time: Low neutral time 0-32.1; High neutral time 32.2-100.
- Neither (0-100) measures neither-happy-nor-unhappy time: Low neutral time 0-29; High neutral time 30-100.
- Happiness Level (0-10) measures subjective happiness: Low 0-7.3; High 7.4-10. 7.3 is a Russian sample mean, not a universal norm.
- Feeling Upbeat (0-100) measures uplifted time: Low uplift 0-50.3; High uplift 50.4-100.
Methodology and Scientific Basis
The first item places the respondent on a continuum from extremely happy to extremely unhappy. The second allocates 100% of time among upbeat, unhappy, and neutral states; the third does so for happy, unhappy, and neither happy nor unhappy. Together, the items combine a global judgment with estimates of emotional frequency.
The item combination is comparable to the Fordyce Happiness Measure from 1988, which pairs an overall happiness judgment with time estimates; Fordyce’s 1977 work offers a related self-report model. This online questionnaire therefore presents items comparable to Fordyce’s measures.
Online scoring displays the selected response position and percentage estimates through its dimensions and bands. The online version has no documented standardized scoring rule for converting each response into points, so its bands are descriptive categories rather than clinical cutoffs.
Higher happiness or uplift indicates more positive reported experience, while greater unhappy or neutral time shows a different balance. Interpretation depends on honest estimates, self-awareness, memory, and present circumstances. Results may shift with recent events and describe the respondent’s account at that moment, making them a focused starting point for reflection rather than an enduring diagnosis.
- Fordyce, M. W. (1988). A review of research on the happiness measures: A sixty second index of happiness and mental health. Social Indicators Research, 20(4), 355-381. 10.1007/BF00302333
- Fordyce, M. W. (1977). Development of a program to increase personal happiness. Journal of Counseling Psychology, 24(6), 511-521. 10.1037/0022-0167.24.6.511
Updated: