
Personality Adaptation Status Assessment Test
How the Scales are Structured
Who Usually Takes This Test?
See How You Compare
Below is a preview of how scores are typically distributed across each scale.
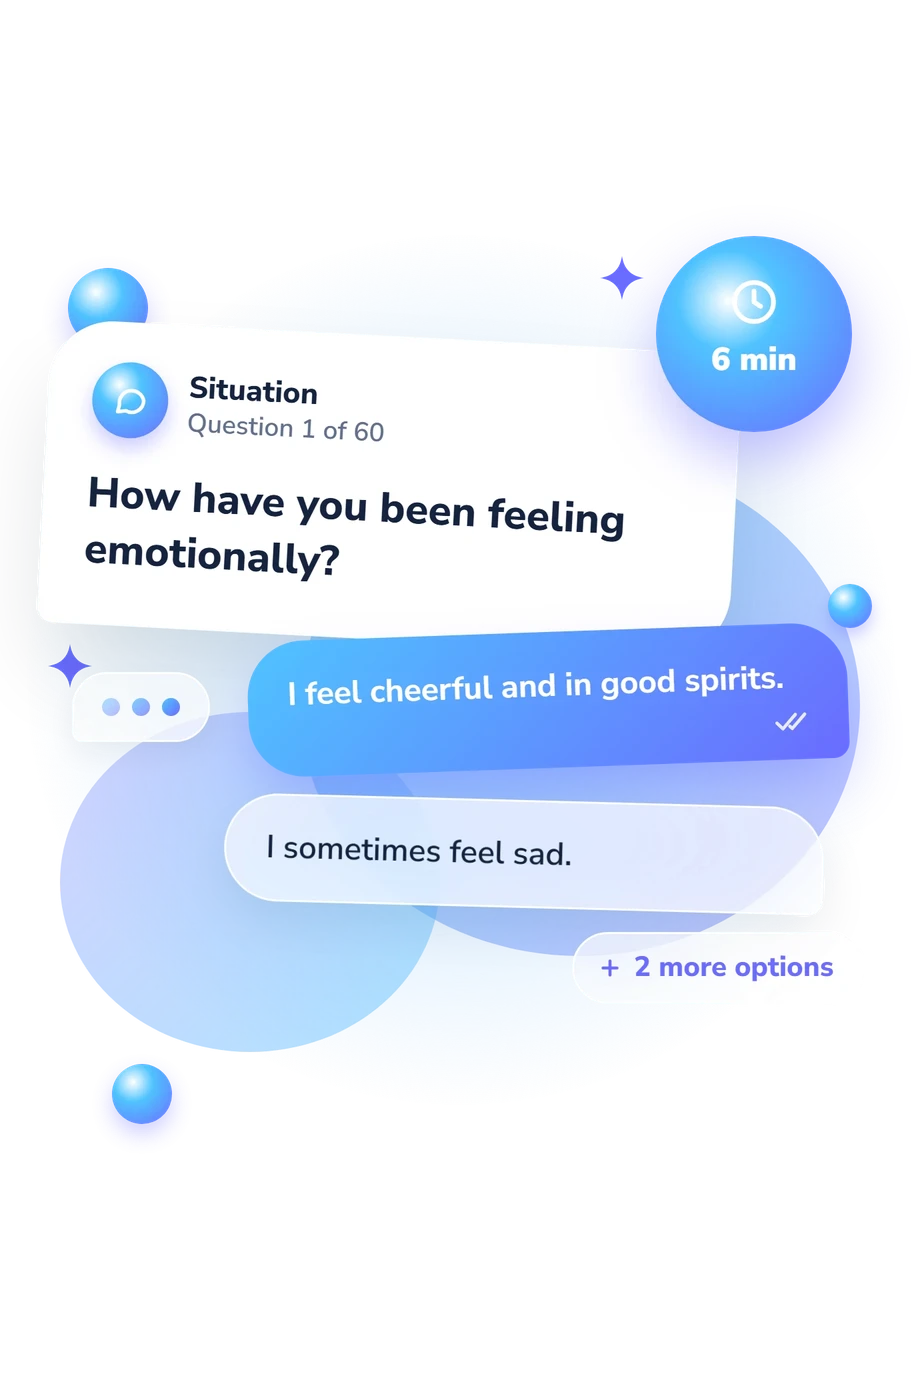
Example Questions From the Test
- I feel cheerful and in good spirits.
- I sometimes feel sad.
- I often feel sad.
- I feel unhappy.
- I had a happy childhood.
- In childhood, I had minor difficulties typical for children.
- I had a rather difficult childhood.
- In childhood, life did not spare me.
- I eat as usual, with a good appetite.
- Lately, my appetite has worsened.
- I notice that sometimes I eat without tasting the food.
- Lately, I hardly eat anything.
Personality Adaptation Status Assessment Test - Description and methodology of the test
Readers who want a structured way to reflect on present functioning can use this questionnaire to examine adaptation across everyday demands and personal experience. The Personality Adaptation Status Assessment Test is intended for people considering how work, health, communication, relationships, and self-view fit together. Viewed as a personality adaptation assessment, it offers a profile of areas that feel settled, mixed, or strained.
What This Assessment Explores
Its personality adaptation profile shows concentrated or widespread strain.
These dimensions are:
- Work and Home Activities (0-18) measures work/home satisfaction: Well-adapted 0-6; Some strain 7-12; Elevated dissatisfaction 13-18.
- Health and Lifestyle (0-18) measures health/lifestyle satisfaction: Comfortable 0-6; Mixed 7-9; Dissatisfied / Strained 10-18.
- Status in Communication (0-18) measures communication satisfaction: Satisfied 0-6; Mixed 7-12; Strained 13-18.
- Life Situation (0-18) measures current-life satisfaction: Adapted 0-6; Elevated strain 7-12; High dissatisfaction 13-18.
- Self-Satisfaction (0-18) measures self-satisfaction: Harmonious 0-6; Mixed/Variable 7-12; Strained 13-18.
- Adaptation Status (0-90) reflects overall adaptation: low scores may indicate quasi-adaptation; average scores indicate successful adaptation; high scores may indicate strain or extreme conditions requiring professional attention; Quasi-adaptive 0-30; Successfully adapted 31-45; High strain 46-90.
Methodology and Scientific Basis
This personality adaptation questionnaire uses four statements ranging from more comfortable or hopeful experiences to more difficult ones, and the respondent selects the best fit for the present situation. Topics include mood, past experience, social connection, self-care, coping, work, finances, and future expectations, so the profile reflects current context as well as personal appraisal.
Scores appear by domain and as a total. The questionnaire supplies these result labels but does not document population norms or how many points each response contributes.
Yakovenko's 1996 OSADA examines maladaptation across emotional, behavioral, social, and everyday functioning. This adaptation status assessment is conceptually consistent with OSADA but is not a standardized adaptation of it; that comparison does not establish population norms for this questionnaire.
Honesty, memory, self-awareness, and present mood can shape responses, so a result may reflect temporary circumstances as well as enduring patterns. Read it as structured self-reflection; it cannot by itself determine a diagnosis or explain the causes of a score.
- Yakovenko, S. I. (1996). Mental maladaptation of law-enforcement officers as a factor of suicide risk. Psychopedagogy in Law Enforcement Agencies, 1(3), 30-31.
- Melnyk, Olena V., & Lukomska, Svitlana O. (2019). Age specificities of the combatants adaptation to civil life conditions. Scientific Bulletin of Kherson State University. Series Psychological Sciences, (2), 71-77. 10.32999/ksu2312-3206/2019-2-10
Updated: