
Psychological Crisis Experience Scale Test
How the Scales are Structured
Who Usually Takes This Test?
See How You Compare
Below is a preview of how scores are typically distributed across each scale.
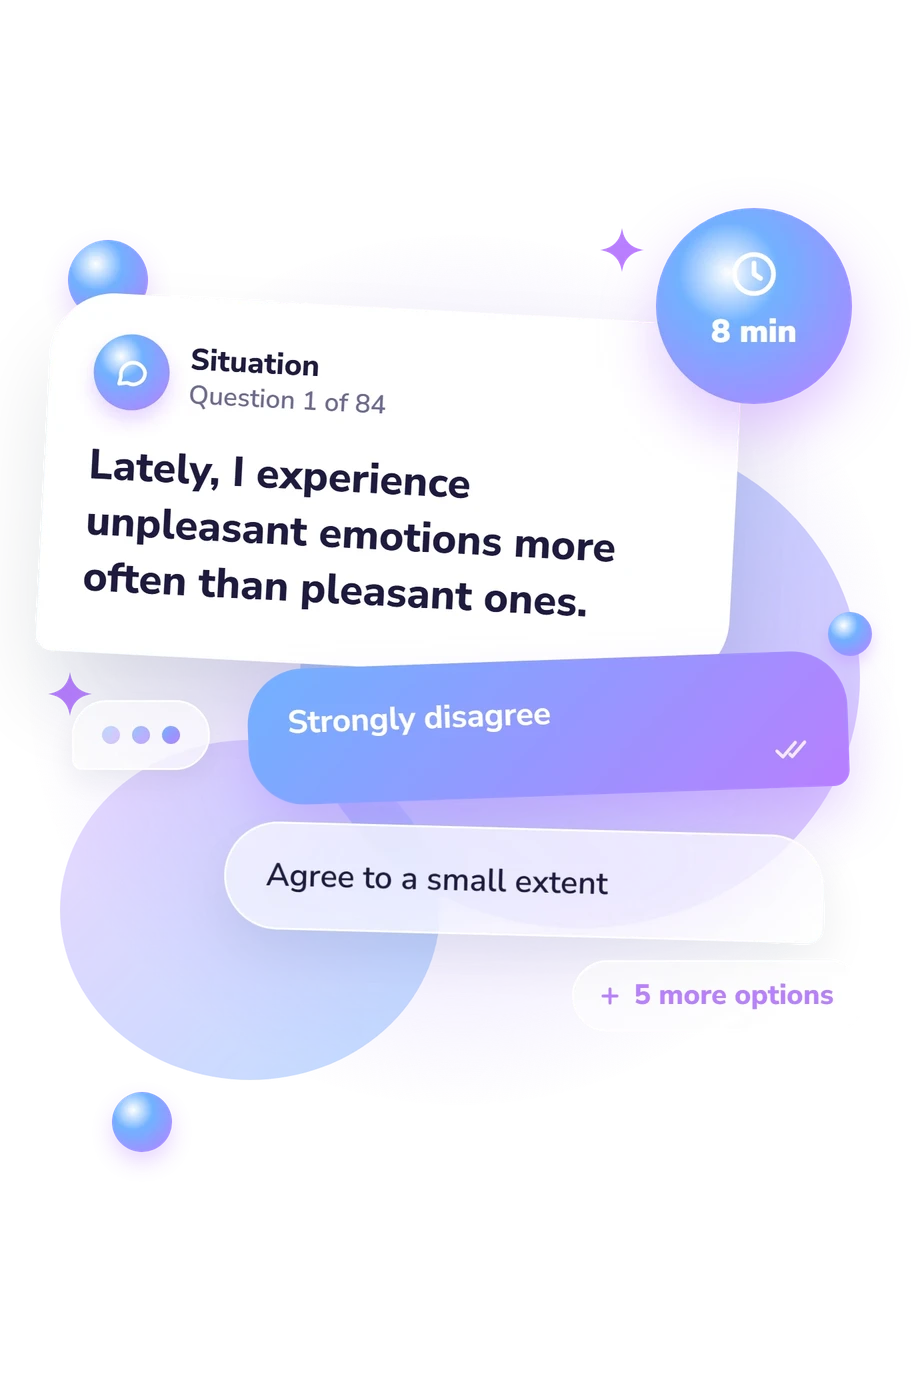
Example Questions From the Test
- Completely disagree
- Agree to a small extent
- Agree almost halfway
- Agree halfway
- Agree more than halfway
- Agree almost completely
- Completely agree
- Completely disagree
- Agree to a small extent
- Agree almost halfway
- Agree halfway
- Agree more than halfway
- Agree almost completely
- Completely agree
- Completely disagree
- Agree to a small extent
- Agree almost halfway
- Agree halfway
- Agree more than halfway
- Agree almost completely
- Completely agree
Psychological Crisis Experience Scale Test - Description and methodology of the test
People navigating intense stress, uncertainty, or a major change may use the Psychological Crisis Experience Scale Test to organize self-reflection. Read the result as a snapshot of current responses, then consider which patterns fit your circumstances and which may merit further attention. This psychological crisis assessment is most useful when answered thoughtfully and interpreted in context.
What This Assessment Measures
This crisis experience assessment measures:
- Psychological Resilience (20-100) reflects coping resources: Low 20-40; Moderate 41-59; High 60-100.
- Disorganization Response (20-100) reflects anxiety and inactivity: Low disorganization 20-40; Moderate disorganization 41-59; High disorganization 60-100.
- Oppositional Reaction (20-100) reflects oppositional behavior: Cooperative 20-40; Mixed 41-59; Oppositional 60-100.
- Demobilization Response (Dm) (20-100) reflects withdrawal: Low 20-40; Moderate 41-59; High 60-100.
- Negative Balance Response (20-100) reflects negative appraisal: Low 20-40; Moderate 41-59; High 60-100.
- Pessimistic Response (20-100) reflects bleak outlook: Optimistic 20-40; Mixed outlook 41-59; Pessimistic 60-100.
- Emotional Imbalance Response (20-100) reflects imbalance: Low imbalance 20-40; Moderate imbalance 41-59; High imbalance 60-100.
- Situational Response Index (20-100) reflects crisis burden: Low 20-40; Moderate 41-59; High 60-100.
Methodology and Evidence Base
The representative statements shown use a seven-point agreement scale, moving from complete disagreement to complete agreement. This format captures degree of endorsement rather than a yes-or-no choice. Results are displayed as separate scale scores, and no question-level scoring rule is provided.
Its evidence base is closest to Dukhnovskiy's 2018 PPC technique, with related discussion by Dukhnovskiy and Zhuravleva (2016) and Dukhnovskiy (2014). The online questionnaire presents a profile format related to the PPC technique, and its items are conceptually consistent with these works.
When completing this crisis response questionnaire, interpret the pattern alongside current stress, mood, memory, self-awareness, and socially shaped responding. A higher score indicates greater prominence of the tendency represented by that scale, not a permanent trait. Results can guide reflection on coping, activity, relationships, and outlook, but they are not a diagnosis or a complete account of functioning.
- Dukhnovskiy, S. V. (2018). Psychodiagnostic Technique “Experiencing a Crisis by a Personality (PPC)”: Description and Possibilities of Use. Bulletin of Kurgan State University, no. 1 (48), pp. 30-35. (In Russian.)
- Dukhnovskiy, S. V., and Zhuravleva, Yu. A. (2016). Ratio of “A Crisis Profile” of the Personality with Type of Psychosomatic Pathology. Bulletin of Science and Practice, no. 1 (2), pp. 43-48. (In Russian.) 10.5281/zenodo.53779
- Dukhnovskiy, S. V. (2014). Experiencing a Psychological Crisis and Situational Personality Reactions. Bulletin of Kurgan State University, no. 1, pp. 78-81. (In Russian.)
Updated: