
Am I Good at Math Quiz
How the Scales are Structured
Who Usually Takes This Test?
See How You Compare
Below is a preview of how scores are typically distributed across each scale.
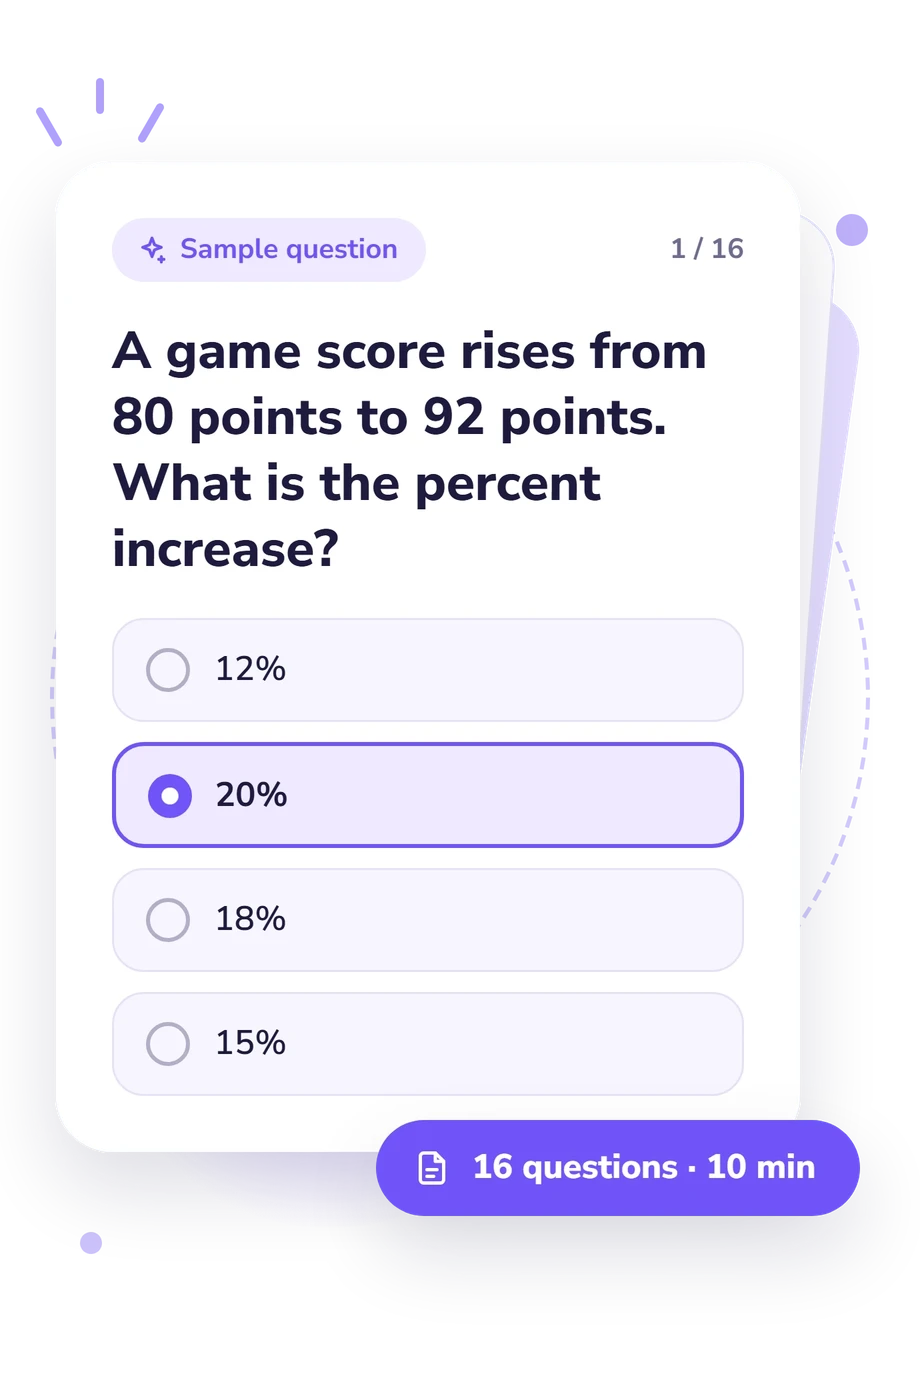
Example Questions From the Test
- 12%
- 20%
- 18%
- 15%
- 2x + 3 = 10
- 3x − 5 = 7
- x ÷ 2 + 5 = 8
- 4x − 2 = 18
- 45 kilometers per hour
- 72 kilometers per hour
- 60 kilometers per hour
- 75 kilometers per hour
Am I Good at Math Quiz - Description and methodology of the test
People who want a clearer picture of their everyday mathematical strengths can use this assessment to examine how they handle familiar problems, instead of relying on a general feeling about numbers. The Am I Good at Math Quiz gives that review a structured format. It suits readers checking their current command of school-level concepts and practical calculations. This math level quiz estimates performance across tested topics.
What This Assessment Explores
The questions sample school and everyday mathematics through operations, fractions, percentages, equations, measurement, geometry, probability, patterns, averages, and proportional thinking. The coverage of this math skills quiz helps indicate which tested areas may merit review.
The themes fall into four groups:
- Number and proportional reasoning show how you calculate, compare quantities, and handle fractions, percentages, rates, and averages.
- Algebraic reasoning shows whether you can represent relationships with equations and determine an unknown.
- Geometry and measurement show how you apply properties of shapes, angles, length, area, and perimeter.
- Data, probability, and patterns show how you interpret uncertainty, sequences, and numerical relationships.
The Math Knowledge scale runs from 0 to 16 correct answers: Foundations to strengthen, 0-6; Developing command, 7-12; and Strong command, 13-16. These bands describe performance on the tested material, not intelligence or educational placement.
Methodology and Evidence Base
Each item presents a problem with four answer choices; you select the mathematically justified response rather than rate confidence. The result is based on the number of correct answers on the item set and is interpreted through the displayed bands.
The content is conceptually consistent with the NAEP Mathematics Framework, which connects mathematical knowledge with reasoning and problem solving. It also aligns conceptually with the National Research Council’s account of mathematical proficiency and the OECD emphasis on applying mathematics in varied contexts. This is an informal correct-answer quiz, not an adaptation of any of these frameworks.
Interpretation is straightforward: more correct answers indicate stronger performance on the sampled concepts, while a lower band points to topics for review. This math ability quiz connects the result to targeted practice based on performance in the sampled domains, although attention, time pressure, prior instruction, and format familiarity can affect performance. The result is a focused snapshot of this question set.
- National Assessment Governing Board. (2022). Mathematics Assessment Framework for the 2022 and 2024 National Assessment of Educational Progress. Washington, DC: U.S. Department of Education.
- National Research Council. (2001). Adding It Up: Helping Children Learn Mathematics. Edited by Jeremy Kilpatrick, Jane Swafford, and Bradford Findell. Washington, DC: National Academies Press. 10.17226/9822.
- OECD. (2023). PISA 2022 Assessment and Analytical Framework. Paris: OECD Publishing. 10.1787/dfe0bf9c-en.
Updated: