
Attention Span Test
How the Scales are Structured
Who Usually Takes This Test?
See How You Compare
Below is a preview of how scores are typically distributed across each scale.
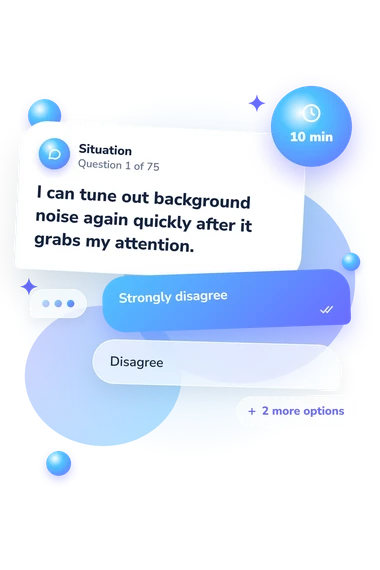
Example Questions From the Test
- Strongly disagree
- Disagree
- Not sure
- Agree
- Strongly disagree
- Disagree
- Not sure
- Agree
- Strongly disagree
- Disagree
- Not sure
- Agree
Attention Span Test - Description and methodology of the test
People seeking a clearer picture of everyday concentration can use this questionnaire to examine attention in ordinary study, work, conversation, and digital environments; its focus test reveals patterns that may guide changes to notifications, task setup, breaks, or recovery routines. The attention span test provides a structured result for understanding attention habits.
What This Assessment Measures
Items address external interruptions-noise, movement, messages, and phone checking-as well as internal shifts involving fatigue, worry, memories, boredom, or unrelated thoughts. They also cover losing your place, missing information, drifting into other activities, and staying engaged during repetitive or demanding work.
This questionnaire produces an attention test profile that describes tendencies across situations and organizes them into three dimensions:
- Distractibility (0-40) shows how strongly internal or external distractions pull you away; bands are Low distractibility 0-13, Moderate distractibility 14-26, and High distractibility 27-40.
- Refocus Recovery (0-30) shows how quickly concentration returns after disruption; bands are Slow to Refocus 0-10, Variable Refocus 11-20, and Quick Refocus 21-30.
- Sustained Attention (0-40) shows how steadily you remain engaged with one task; bands are Low 0-13, Moderate 14-27, and High 28-40.
Methodology and Evidence Base
The presented items use four-point agreement responses. Some choices run from Strongly disagree through Disagree and Not sure to Agree; others run from Strongly disagree through Disagree and Agree to Strongly agree. Some statements are worded in the opposite direction, so agreement does not always point in the same scoring direction. Responses are combined into three displayed scores, with higher values reflecting more of the tendency defined for that dimension.
Methodologically, the questionnaire is conceptually consistent with the Attentional Control Scale (Derryberry & Reed, 2002), which examines regulation of attention, including shifting and maintaining focus. It is not presented as an adaptation of that published scale. The themes overlap with Derryberry and Rothbart's 1988 temperament framework, linking attention with arousal and affect.
Applying this assessment to everyday observations helps show how to test attention span in daily life; the profile is most useful when read alongside the situations that shaped each answer. The displayed bands organize this questionnaire's results; they do not establish population norms by themselves. Since self-report is affected by sleep, stress, motivation, workload, and context, the scores are a snapshot of reported tendencies rather than a diagnosis or fixed capacity.
- Derryberry, D., & Reed, M. A. (2002). Anxiety-related attentional biases and their regulation by attentional control. Journal of Abnormal Psychology, 111(2), 225-236. 10.1037/0021-843X.111.2.225
- Derryberry, D., & Rothbart, M. K. (1988). Arousal, affect, and attention as components of temperament. Journal of Personality and Social Psychology, 55(6), 958-966. 10.1037/0022-3514.55.6.958