
Am I Weird Quiz
How the Scales are Structured
Who Usually Takes This Test?
See How You Compare
Below is a preview of how scores are typically distributed across each scale.
Example Questions From the Test
- Strongly disagree
- Disagree
- Not sure
- Agree
- Strongly disagree
- Disagree
- Not sure
- Agree
- Strongly disagree
- Disagree
- Not sure
- Agree
Am I Weird Quiz - Description and methodology of the test
People who question whether their habits, preferences, or social manner stand out can use the Am I Weird Quiz to compare those patterns across everyday life. It is intended for anyone who wants a clearer account of unusualness in habits, sensory experiences, and social interaction. The profile answers the question that brings someone to this how weird am i quiz, showing where your style appears conventional, quirky, sensory-specific, or socially offbeat.
What This Assessment Explores
Items cover food, routines, sensory input, interests, humor, wording, and social expectations, giving this weird test its broad profile.
The result has three dimensions:
- Quirkiness Level (0-40) measures unconventional habits, interests, and preferences; higher scores reflect frequent, noticeable, or distinctive quirks; lower scores reflect a typical style. Bands: Mostly Mainstream (0-13), Moderately Quirky (14-27), Highly Distinctive (28-40).
- Sensory Uniqueness (0-30) measures sensory preferences and sensitivities; higher scores reflect pronounced likes, dislikes, and stronger sensory reactions; lower scores reflect more flexible, less intense preferences. Bands: Flexible (0-10), Distinct (11-20), Pronounced (21-30).
- Social Offbeat Style (0-30) measures how communication, humor, and social approach may feel in groups; higher scores reflect an unconventional style that can stand out or be misunderstood; lower scores reflect a conventional style. Bands: Conventional (0-10), Moderately Offbeat (11-20), Highly Offbeat (21-30).
The profile shows broad or concentrated distinctiveness.
Methodology and Scientific Basis
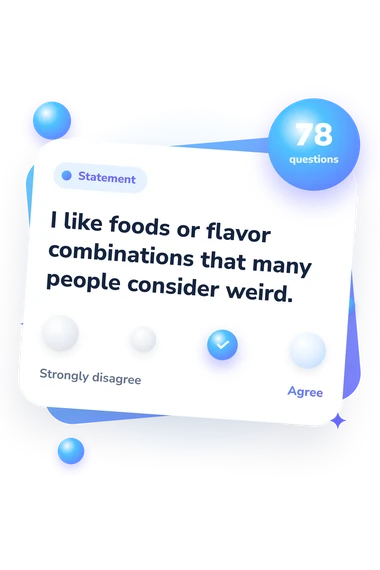
In the demonstrated items, each statement is followed by four choices-Strongly disagree, Disagree, Not sure, or Agree. Respondents rate how well statements about everyday habits, sensory experiences, preferences, and social style fit them. There is no correct answer; the pattern describes the tendencies represented in the profile. As a weirdness test, this format captures degrees of fit across everyday contexts.
Responses are combined into dimensional scores and placed into the displayed bands. The questionnaire does not state a standardized item-to-point conversion or population norm, so its numeric ranges function as descriptive categories rather than universal cutoffs.
The test’s multidimensional treatment is conceptually consistent with Hätscher and colleagues’ 2026 work on unusualness, Kim and colleagues’ 2023 study of perceived weirdness as a normality evaluation, and the Sensory Perception Quotient, or SPQ, developed by Tavassoli, Hoekstra, and Baron-Cohen. These works do not validate this questionnaire, and it is not an adaptation of them.
Interpret higher scores as stronger expression of the relevant scale tendency. Because answers are self-reported, results can shift with current context, self-awareness, and response style.
- Hätscher, O., Breitmoser, Y., Kaiser, M. I., Klinz, J. L., Kroencke, L., Kuper, N., Mõttus, R., Niemeyer, L. M., Scharbert, J., Vainik, U., & Back, M. D. (2026). Who stands out? Defining, measuring, and uncovering the elements of unusualness. European Journal of Personality, 40(4). 10.1177/08902070261430547
- Kim, J.-Y., Newman, D. A., Harms, P. D., & Wood, D. (2023). Perceived Weirdness: A Multitrait-Multisource Study of Self and Other Normality Evaluations. Personality Science, 4, Article e7399. 10.5964/ps.7399
- Tavassoli, T., Hoekstra, R. A., & Baron-Cohen, S. (2014). The Sensory Perception Quotient (SPQ): development and validation of a new sensory questionnaire for adults with and without autism. Molecular Autism, 5, Article 29. 10.1186/2040-2392-5-29