
Optical Illusions Quiz
How the Scales are Structured
Who Usually Takes This Test?
See How You Compare
Below is a preview of how scores are typically distributed across each scale.
Example Questions From the Test
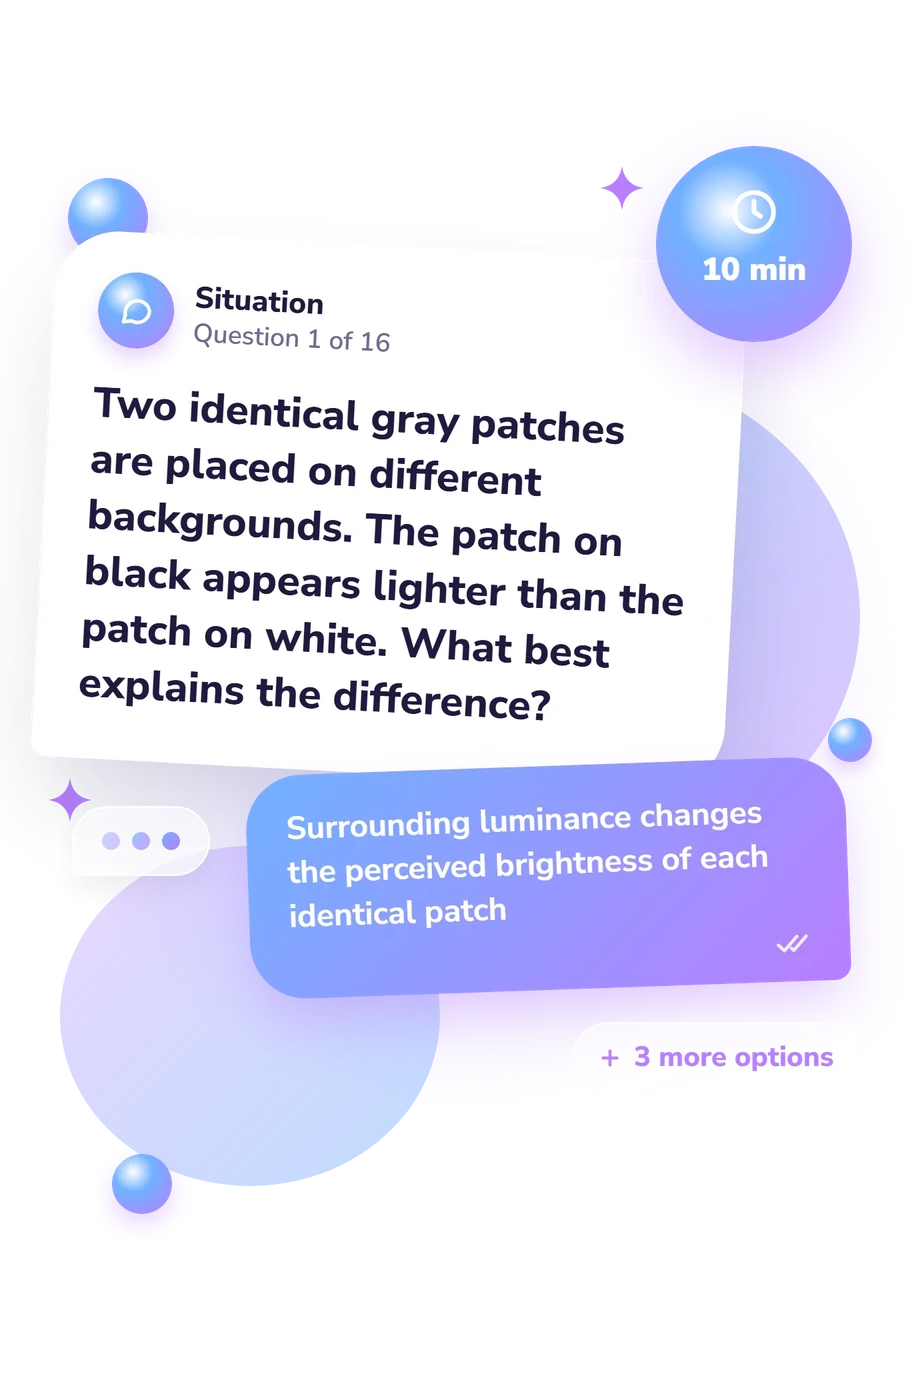
- Surrounding luminance changes the perceived brightness of each identical patch
- The white background causes a binocular depth mismatch
- One patch develops an afterimage before the other
- The black background adds more light to its gray patch
- Color constancy makes distant objects look brighter
- Perspective cues make the higher bar seem farther away, so the visual system scales its apparent size
- Retinal fatigue stretches shapes viewed near the horizon
- Binocular rivalry causes each eye to see a different bar
- A motion aftereffect
- A color-constancy illusion
- A size illusion caused by perspective
- A bistable figure-ground illusion
Optical Illusions Quiz - Description and methodology of the test
Readers who want to understand why identical stimuli can look different can use this optical illusions quiz to examine core principles of visual perception. It suits curious learners, students, and educators who want to test conceptual knowledge rather than eyesight. The result indicates how confidently you recognize mechanisms involving context, perspective, motion, colour, and depth. It is not an optical illusions personality quiz; it describes knowledge, not character.
What This Assessment Explores
Rather than measuring eyesight, the assessment asks you to connect a described effect with the perceptual principle that explains it. This illusions quiz covers changes in brightness and size caused by context, perspective-based distance cues, motion aftereffects, colour constancy, binocular depth, and ambiguous figures.
These themes fall into four groups:
- Context and contrast show how backgrounds and neighboring shapes alter apparent brightness or size.
- Perspective and depth cues show how geometry and binocular disparity support size and three-dimensional perception.
- Motion and adaptation show how prolonged or sequential stimulation can create apparent movement.
- Figure-ground and completion effects show how perception switches interpretations or fills missing detail.
Together, the items examine whether a respondent can distinguish mechanisms behind surprising visual experiences. A strong result means accurate recognition of perceptual principles across varied examples, not superior eyesight.
Methodology and Evidence Base
Each item presents a situation, demonstration, or definition with four answer choices. Choosing the explanation that best fits the mechanism makes the format a test of conceptual recognition rather than self-rating. The displayed result is Optical Illusions Knowledge (0-16), with Foundations to build (0-6), Developing observer (7-12), and Illusion-savvy (13-16). These bands describe quiz knowledge; they do not measure visual health or ability.
Several questions distinguish closely related processes, including colour constancy, binocular disparity, figure-ground reversal, blind-spot completion, apparent motion, and complementary afterimages. A hard quiz about optical illusions can therefore expose gaps between familiar effects while indicating which topics deserve review.
Shapiro and Todorovic (2017) provide the closest reference for these illusion classes. Martinez-Conde and Macknik (2010) connect visual illusions with neural processing, while Gregory (1997) explains how vision interprets brightness, movement, colour, depth, and objects. The questionnaire is conceptually consistent with these works, not an adaptation of any one of them.
As an online, non-standardized questionnaire, performance can vary with prior exposure, guessing, attention, and current interest. The band is a knowledge snapshot, not a normed assessment of visual functioning.
- Shapiro, Arthur G., & Todorovic, Dejan (Eds.). (2017). The Oxford Compendium of Visual Illusions. Oxford University Press. 10.1093/acprof:oso/9780199794607.001.0001
- Martinez-Conde, Susana, & Macknik, Stephen L. (2010). Visual Illusions. In E. Bruce Goldstein (Ed.), Encyclopedia of Perception (pp. 1077-1081). SAGE Publications. 10.4135/9781412972000.n344
- Gregory, Richard L. (1997). Eye and Brain: The Psychology of Seeing (5th ed.). Princeton University Press. 10.2307/j.ctvc77h66
Updated: