
Favorite Food Quiz
How the Scales are Structured
Who Usually Takes This Test?
See How You Compare
Below is a preview of how scores are typically distributed across each scale.
Example Questions From the Test
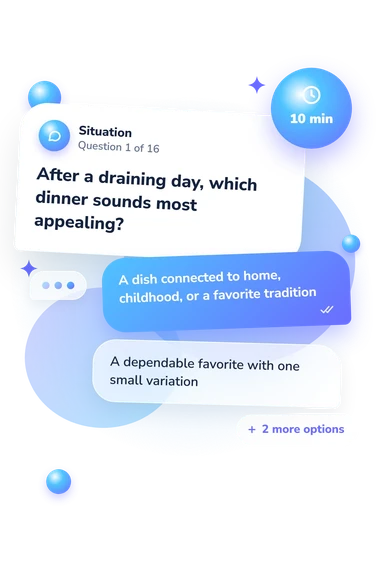
- A dish connected to home, childhood, or a favorite tradition
- A dependable favorite with one small variation
- Whatever satisfying meal is easiest with what I have
- Something completely new that changes the mood
- Recreate its taste as closely as possible at home
- Find a similar product and adjust it to my liking
- Choose another dependable staple
- Treat the change as a reason to explore a different category
- I want to try it because the whole idea feels fun
- I would pick it up if the flavor still sounds appealing
- I would rather choose a classic version of the treat
- I would spend the snack choice on something savory and practical
Favorite Food Quiz - Description and methodology of the test
People who want to understand why certain meals feel comforting, exciting, or satisfying can use the favorite food quiz as a guided reflection on taste. For someone asking what is my favorite food, the result offers a profile rather than naming one dish. It helps curious readers connect everyday cravings with memories, social choices, freshness, intensity, sweetness, and novelty.
What This Assessment Explores
This questionnaire treats food preference as priorities in ordinary situations, including comfort, novelty, heat, sweetness, social meals, and memories. The result answers what is your favorite food through relative affinities rather than one permanent favorite.
These dimensions describe the main qualities reflected in the result:
- Blue - Comfort & Familiarity (0-12) reflects dependable favorites and nostalgia: Open Table (0-4), Comfort Keeper (5-8), Classic Heart (9-12).
- Green - Fresh & Balanced (0-12) reflects fresh ingredients, clear flavors, variety, and balance: Rich Focus (0-4), Seasonal Mix (5-8), Garden Palette (9-12).
- Red - Bold & Spicy (0-12) reflects intensity, contrast, and experimentation: Gentle Explorer (0-4), Flavor Spark (5-8), Bold Flame (9-12).
- Yellow - Playful & Sweet (0-12) reflects sweetness, cheerful presentation, novelty treats, and celebration: Savory Spirit (0-4), Joyful Taster (5-8), Sunshine Treat (9-12).
The highest score is the strongest affinity; scores within one point create a blended result.
Methodology and Evidence
Each scenario presents four answer choices, and the respondent selects the option that best matches a preference or likely choice. The alternatives span familiar, fresh, intense, sweet, and mixed directions, so the profile compares priorities instead of naming one dish. For anyone wondering what's my favorite food, the result gives a pattern across scales.
Scores are summarized on four dimensions. The highest identifies the leading affinity, while scores within one point create a blended profile. The displayed ranges define result bands; they do not establish a separate points-per-answer rule.
Methodologically, the questionnaire is conceptually consistent with the Food Attitudes Survey (FAS), the Food Choice Questionnaire, research on food neophobia, and findings on personality factors related to spicy-food liking. Together, these sources support examining attitudes, motives, novelty tolerance, and intensity preference. This online tool is not presented as an adaptation, standardized version, or validated form of any one instrument.
A question such as what's your favorite food is answered as a reflective snapshot, not a fixed account of eating behavior. Mood, memory, culture, current access, social context, and self-awareness can influence self-report, so results are best used to notice patterns rather than make broad conclusions.
- Raudenbush, B., van der Klaauw, N. J., & Frank, R. A. (1995). The contribution of psychological and sensory factors to food preference patterns as measured by the Food Attitudes Survey (FAS). Appetite, 25(1), 1-15. 10.1006/appe.1995.0037
- Steptoe, A., Pollard, T. M., & Wardle, J. (1995). Development of a measure of the motives underlying the selection of food: The Food Choice Questionnaire. Appetite, 25(3), 267-284. 10.1006/appe.1995.0061
- Pliner, P., & Hobden, K. (1992). Development of a scale to measure the trait of food neophobia in humans. Appetite, 19(2), 105-120. 10.1016/0195-6663(92)90014-W
- Byrnes, N. K., & Hayes, J. E. (2013). Personality factors predict spicy food liking and intake. Food Quality and Preference, 28(1), 213-221. 10.1016/j.foodqual.2012.09.008