
What Generation Am I Quiz
How the Scales are Structured
Who Usually Takes This Test?
See How You Compare
Below is a preview of how scores are typically distributed across each scale.
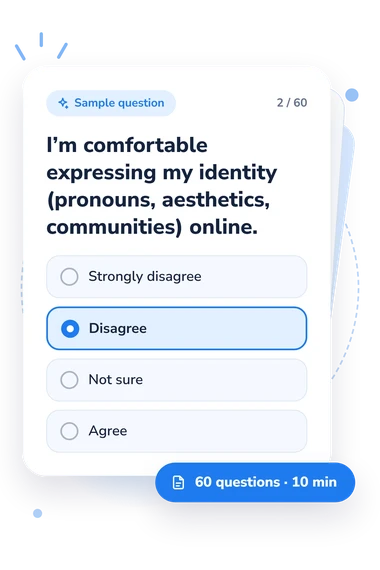
Example Questions From the Test
- Strongly disagree
- Disagree
- Not sure
- Agree
- Strongly disagree
- Disagree
- Not sure
- Agree
- Strongly disagree
- Disagree
- Not sure
- Agree
What Generation Am I Quiz - Description and methodology of the test
For readers curious about cultural habits behind cohort affinities, this assessment offers a comparative profile rather than a birth-year verdict. The What Generation Am I Quiz highlights alignment with media memories, communication preferences, and technology habits associated with each displayed profile. By comparing Gen Z and Millennial patterns with the combined Gen X/Boomer profile, this gen z or millennial quiz includes all three displayed scales.
What This Assessment Explores
The questionnaire reads generational affinity through experiences rather than asking you to adopt a label. Items cover pre-smartphone technology, desktop computing, DVDs, downloaded music, social feeds, creators, short video, personalized platforms, online language, communication style, social values, and cultural touchstones. It is suited to anyone comparing personal habits with cohort patterns.
The result functions as a generation affinity quiz by showing three dimensions:
- Gen X/Boomer Affinity (0-40) measures alignment with analog-first childhood, broadcast media, and different technology adoption; Low affinity 0-13, Moderate affinity 14-26, High affinity 27-40.
- Gen Z Affinity (0-40) measures alignment with digital-native habits, contemporary social media, current culture, and related values; Low affinity 0-13, Moderate affinity 14-26, High affinity 27-40.
- Millennial Affinity (0-40) measures alignment with internet-transition experiences, early social platforms, late-1990s and 2000s culture, and related work-life attitudes; Low affinity 0-13, Moderate affinity 14-27, High affinity 28-40.
Methodology and Evidence Base
The questions shown use four response options-Strongly disagree, Disagree, Not sure, or Agree-to capture remembered experiences, present preferences, and cultural familiarity. The result presents three affinity scores, with higher values indicating closer alignment with the corresponding profile and lower values indicating weaker alignment; it is a comparative description rather than a pass-or-fail judgment.
The questionnaire links technology behavior with cohort-associated cultural cues, making it a generational comparison quiz rather than a single-label result. It is conceptually consistent with Calvo-Porral and Pesqueira-Sanchez (2020), whose work compares technology behavior among Millennials and Generation X. Dimock (2019) offers a descriptive boundary between Millennials and Generation Z. These studies are conceptual comparators for the questionnaire’s cohort-associated technology and media themes, not evidence that it reproduces either source’s instrument or population.
The displayed bands are descriptive affinity levels: read them as stronger or weaker alignment across profiles rather than as a demand to select one definitive generation. Because the answers rely on memory and self-report, results may shift with current interests, cultural background, technology access, or familiarity with generational stereotypes.
- Calvo-Porral, Cristina, and Rogelio Pesqueira-Sanchez. "Generational differences in technology behaviour: comparing millennials and Generation X." Kybernetes, 49(11), 2755-2772, 2020. 10.1108/K-09-2019-0598.
- Islam, Azharul, and Shamsul Haque. "Construction and Validation of a Generational Identity Scale on Bangladeshi Older Adults." Frontiers in Psychology, 12, Article 703237, 2021. 10.3389/fpsyg.2021.703237.
- Dimock, Michael. "Defining generations: Where Millennials end and Generation Z begins." Pew Research Center, January 17, 2019.