
Freudly+971 508685814hello@freudly.ai
Freudly
psychopathology

Scale for the Assessment of Negative Symptoms (SANS) Test
Take the online Scale for the Assessment of Negative Symptoms (SANS) Test - AI psychologist FreudlyYou can take Scale for the Assessment of Negative Symptoms (SANS) Testhere. Online version of a simple and accurate psychological test with interpretation.en
Understand negative symptoms like apathy, flat affect, and low speech in about 5 minutes. A 25-item, structured format supports consistent ratings and clear tracking over time.
Start Online Test
Questions: 255 minutes
08:30
October 2, 2025
October 2, 2025
Material has been updated
October 2, 2025
Material has been published
20,088 views
1,737 completions
1,411 likes
Verified by Daniel Hall
Psychologist with 25 years of experience
Share
Scale Explorer

How the Scales are Structured

example score
3/5
Anhedonia (Global Score) (AS)
Assesses the clinician-rated degree of reduced interest and diminished ability to experience pleasure from activities.
Low
Moderate
High
01: Low | 23: Moderate | 45: High
A score of 3 falls in the Moderate range, indicating a noticeable reduction in interest and pleasure relative to typical functioning.
example score
3/5
Avolition (Global Score) (AS)
This scale rates the clinician-observed severity of reduced motivation, willpower, and initiation of goal-directed activity (abulia).
Low
Moderate
High
01: Low | 23: Moderate | 45: High
A score of 3 falls in the Moderate range, indicating a noticeable reduction in energy and initiative that can interfere with everyday activities.
example score
3/5
Alogia (Global Score) (AS)
Assesses the clinician-rated severity of reduced speech output and impoverished thought processes (alogia).
Low
Moderate
High
01: Low | 23: Moderate | 45: High
A score of 3 indicates a moderate level of alogia, with noticeable reductions in spontaneity and amount of speech.
example score
7/20
Anhedonia (A)
Assesses reduced capacity to experience pleasure and interest in typical activities, especially social engagement.
Low
Moderate
High
06: Low | 713: Moderate | 1420: High
A score of 7 falls in the Moderate range, indicating a noticeable reduction in pleasure or interest across usual activities.
example score
2/5
Affective Flattening (Global Score) (AFS)
This scale quantifies the clinician-observed reduction in the patient's emotional expressiveness (affective flattening).
Minimal/none
Mild–moderate
Marked–severe
01: Minimal/none | 23: Mild–moderate | 45: Marked–severe
A score of 2 indicates a mild to moderate reduction in observable emotional expression during interaction and observation.
example score
2/5
Attention Impairment (Global Score) (AIS)
This scale reflects the clinician’s overall impression of the severity of concentration and sustained-attention difficulties based on observation and interview.
None–Minimal
Mild–Moderate
Marked–Severe
01: None–Minimal | 23: Mild–Moderate | 45: Marked–Severe
A score of 2 falls in the Mild–Moderate range, suggesting noticeable but not severe difficulties with maintaining attention.
example score
7/25
Total Summary Score (TSS)
This scale summarizes the clinician’s overall impression of the severity of negative symptoms based on observation and dialogue.
Low severity
Moderate severity
High severity
08: Low severity | 916: Moderate severity | 1725: High severity
A total score of 7 falls in the Low severity range, suggesting a relatively mild overall level of observed negative symptoms on this assessment.
example score
43/100
Sum of Subscale Scores (SoSS)
This scale sums intermediate SANS ratings to quantify the overall severity of observed negative symptoms.
Low
Moderate
High
033: Low | 3466: Moderate | 67100: High
A score of 43 falls in the Moderate range, indicating a moderate overall severity of the negative symptoms captured by the intermediate ratings.
example score
8/10
Attention Impairment (AI)
Measures observable difficulties with focusing, sustaining attention, and resisting distraction during tasks or conversation.
Low
Moderate
High
03: Low | 46: Moderate | 710: High
A score of 8 falls in the High range, indicating marked distractibility and reduced ability to maintain attention in observed interactions.
example score
12/15
Avolition (A)
Assesses the severity of abulia, reflecting reduced drive, initiative, and goal-directed activity without prominent depressive affect.
Low
Moderate
High
05: Low | 610: Moderate | 1115: High
A score of 12 falls in the High range, indicating marked and persistent reductions in motivation and initiative with likely impact on everyday functioning.
example score
9/20
Alogia (A)
Assesses the severity of reduced speech output and impoverished verbal thought content (alogia) observed during interaction.
Low
Moderate
High
06: Low | 713: Moderate | 1420: High
A score of 9 falls in the Moderate range, indicating noticeable but not extreme reductions in speech amount and/or content during observation.
example score
10/35
Affective Flattening (AF)
Assesses reduced emotional expressiveness and responsiveness as observed in behavior and reactions.
Low
Moderate
High
011: Low | 1223: Moderate | 2435: High
A score of 10 falls in the Low range, suggesting relatively mild observed reduction in emotional expressiveness and responsiveness.
example score
47/125
Total Score (TS)
This scale quantifies the overall severity of negative symptoms such as reduced emotional expression, poverty of speech, low motivation, diminished pleasure, and attention deficits.
Low
Moderate
High
029: Low | 3060: Moderate | 61125: High
A score of 47 falls in the Moderate range, indicating a noticeable but not extreme overall level of negative symptom severity on the SANS.
Start Online Test
just completed the test
DATA-BASED USER COHORTS

Who Usually Takes This Test?

Psychiatrists in clinical practice
44%OF USERS
They use the scale to quickly rate negative symptoms in schizophrenia-spectrum disorders and track changes during treatment.
Clinical psychologists and therapists
33%OF USERS
They complete it during structured observation and interviews to document emotional flattening, apathy, and reduced speech.
Residents and mental health trainees
23%OF USERS
They take it to learn a standardized, quantitative way to recognize and communicate negative symptoms within a care team.
BASED ON AGGREGATED, ANONYMIZED DATA FROM TENS OF THOUSANDS OF FREUDLY USERS.
Benchmarking

See How You Compare

Once you complete the test, your results are compared with real-world data from people in your country.
Below is a preview of how scores are typically distributed across each scale.
Anhedonia (composite score) (A(s)
Average
2.3
Normal range
1.43.1
min.
0
max.
5
This curve shows how scores are typically distributed.
Once you complete the test, your result will appear on the scale so you can see how you compare.
Abulia (overall score) (A(s)
Average
3.2
Normal range
2.34.1
min.
0
max.
5
This curve shows how scores are typically distributed.
Once you complete the test, your result will appear on the scale so you can see how you compare.
Alogia (General Score) (A(S)
Average
2.9
Normal range
2.13.6
min.
0
max.
5
This curve shows how scores are typically distributed.
Once you complete the test, your result will appear on the scale so you can see how you compare.
Anhedonia (A)
Anhedonia (A)
Average
8.5
Normal range
512.1
min.
0
max.
20
This curve shows how scores are typically distributed.
Once you complete the test, your result will appear on the scale so you can see how you compare.
Affective flattening (composite score) (Af(s)
Average
2
Normal range
1.42.7
min.
0
max.
5
This curve shows how scores are typically distributed.
Once you complete the test, your result will appear on the scale so you can see how you compare.
Attention Disorders (Composite Score) (AD(S)
Average
2.2
Normal range
1.43.1
min.
0
max.
5
This curve shows how scores are typically distributed.
Once you complete the test, your result will appear on the scale so you can see how you compare.
Total of aggregated scores (Toas)
Average
12.1
Normal range
7.916.2
min.
0
max.
25
This curve shows how scores are typically distributed.
Once you complete the test, your result will appear on the scale so you can see how you compare.
Sum of intermediate scores (Sois)
Average
66.5
Normal range
5280.9
min.
0
max.
100
This curve shows how scores are typically distributed.
Once you complete the test, your result will appear on the scale so you can see how you compare.
Attention Disorders (AD)
Average
5.6
Normal range
4.17.1
min.
0
max.
10
This curve shows how scores are typically distributed.
Once you complete the test, your result will appear on the scale so you can see how you compare.
Abulia (A)
Abulia (A)
Average
8.9
Normal range
6.411.4
min.
0
max.
15
This curve shows how scores are typically distributed.
Once you complete the test, your result will appear on the scale so you can see how you compare.
Alogia (A)
Alogia (A)
Average
10.3
Normal range
713.6
min.
0
max.
20
This curve shows how scores are typically distributed.
Once you complete the test, your result will appear on the scale so you can see how you compare.
Affective Flattening (AF)
Average
12.7
Normal range
8.217.3
min.
0
max.
35
This curve shows how scores are typically distributed.
Once you complete the test, your result will appear on the scale so you can see how you compare.
Overall score (Os)
Overall score (Os)
Average
55.1
Normal range
37.472.8
min.
0
max.
125
This curve shows how scores are typically distributed.
Once you complete the test, your result will appear on the scale so you can see how you compare.
Featured On
SAMPLE QUESTIONS

Example Questions From the Test

Symptom ratings should be completed by one, or preferably two, experienced raters who are thoroughly familiar with the scale’s glossary. At hospital admission and during the initial assessment, symptoms are rated for the month preceding hospitalization. To evaluate treatment effectiveness, the scale may be administered weekly or less frequently; in such cases, ratings should cover the interval since the previous assessment.
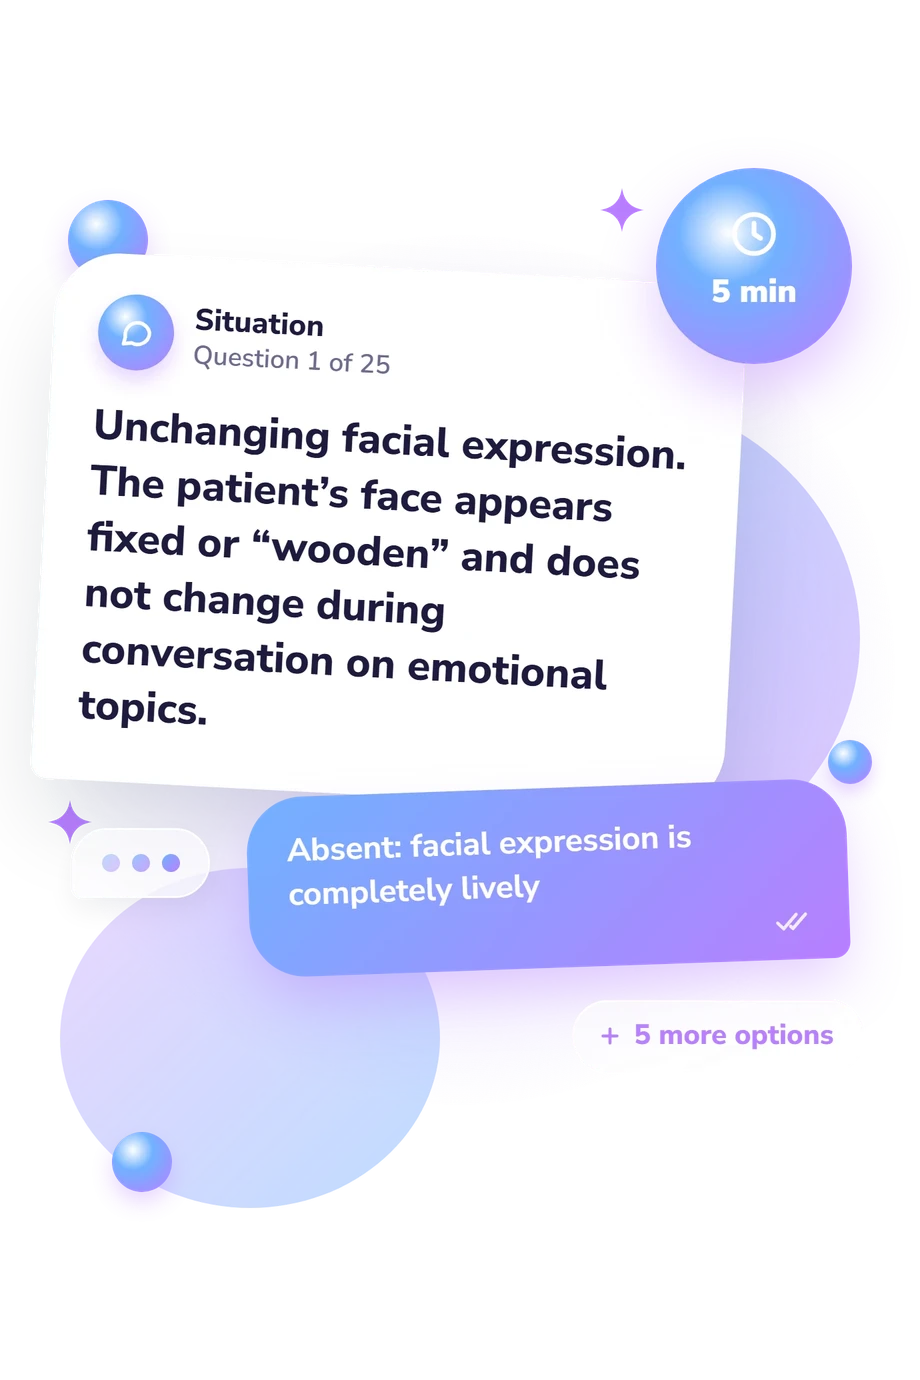
    • Absent: facial expression is completely lively
    • Questionable reduction in facial expressiveness and animation
    • Mild: facial expressiveness is slightly reduced, or the face becomes fixed intermittently
    • Moderate: facial expressiveness is clearly reduced
    • Marked reduction in facial expressiveness, but facial reactions may occur at times
    • Severe: the face is a fixed (“wooden”) mask that does not change during the interview
    • Absent
    • Questionable pathology
    • Mild – one episode of blocking in 15 minutes
    • Moderate – two episodes in 15 minutes
    • Marked – three episodes of speech blocking in 15 minutes
    • Severe – more than three episodes in 15 minutes
    • absent
    • questionable pathology
    • mild but definite
    • moderate
    • marked pathology
    • severe
WHAT THE TEST MEASURES
About This Assessment

Scale for the Assessment of Negative Symptoms (SANS) Test - Symptoms and Signs

psychopathology
schizophrenia

In clinical evaluation of psychotic-spectrum conditions, negative symptoms may be less apparent than positive symptoms but can substantially affect functioning. The Scale for the Assessment of Negative Symptoms (SANS) is a clinician-rated measure designed to systematically assess the presence and severity of core negative symptom domains based on interview and behavioral observation. It was developed by Nancy C. Andreasen.

The instrument includes 25 items and typically takes about 5 minutes to complete. Ratings support quantification of symptom severity and can be used to document baseline presentation and to track change over time; the Scale for the Assessment of Negative Symptoms (SANS) is commonly incorporated into broader diagnostic and treatment-monitoring assessments.

Author: Nancy C. Andreasen
Literature: Andreasen, N. C. The Scale for the Assessment of Negative Symptoms (SANS): conceptual and theoretical foundations. The British Journal of Psychiatry. Supplement. 1989.; Kirkpatrick, B., Fenton, W. S., Carpenter, W. T., & Marder, S. R. The NIMH-MATRICS consensus statement on negative symptoms. Schizophrenia Bulletin. 2006.
Popular tests
Comments
Leave a Comment