
Freudly+971 508685814hello@freudly.ai
Freudly
psychopathology

Scale for the Assessment of Positive Symptoms (SAPS) Test
Take the online Scale for the Assessment of Positive Symptoms (SAPS) Test - AI psychologist FreudlyYou can take Scale for the Assessment of Positive Symptoms (SAPS) Testhere. Online version of a simple and accurate psychological test with interpretation.en
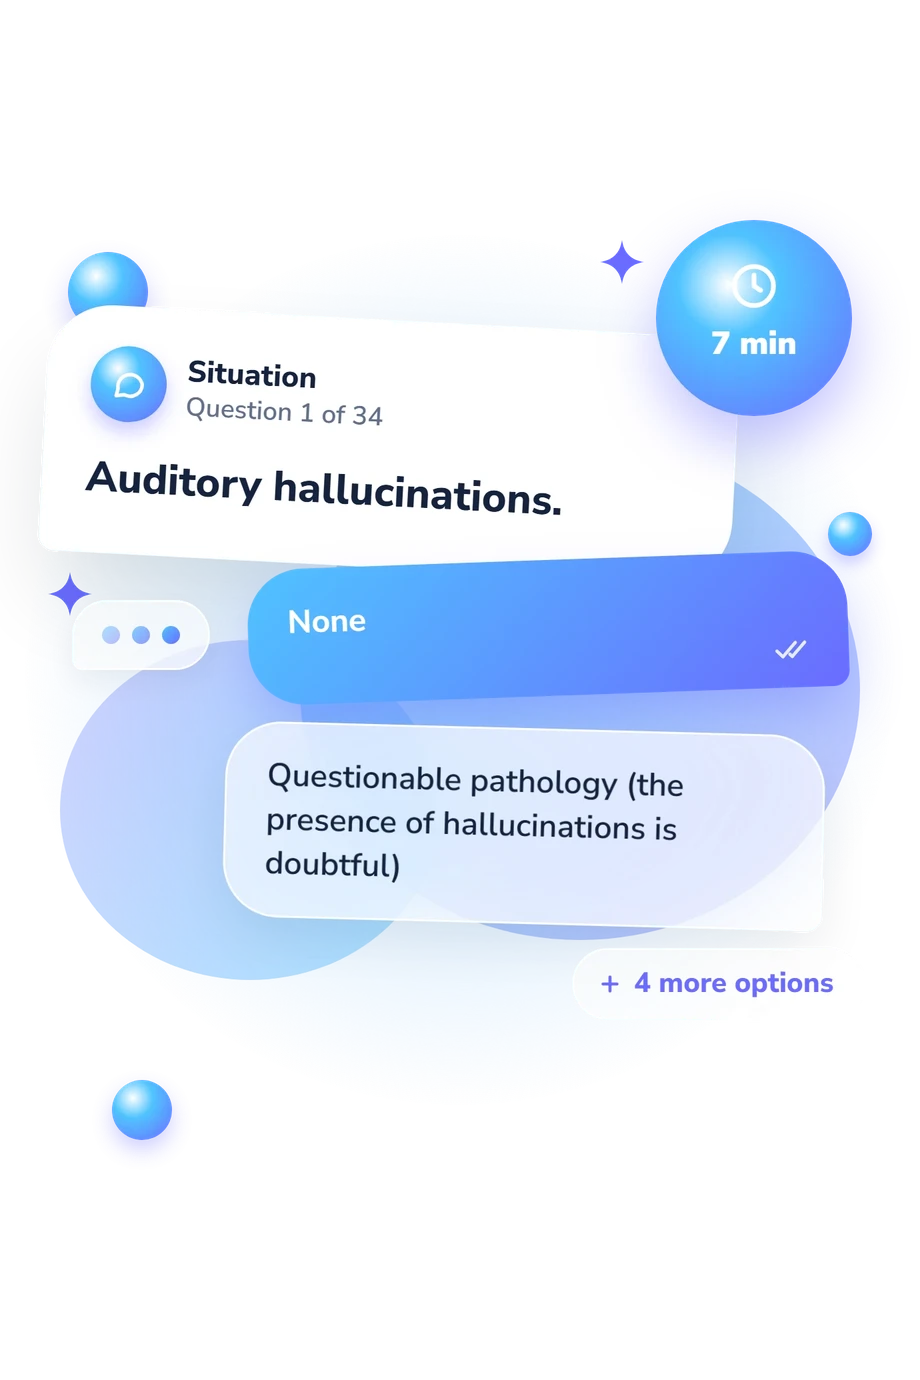
In about 7 minutes, it helps clarify positive symptoms of schizophrenia by tracking what shows up in speech, perception, and behavior. Clear scoring supports treatment planning and reliable progress tracking over time.
Start Online Test
Questions: 347 minutes
08:30
October 2, 2025
October 2, 2025
Material has been updated
October 2, 2025
Material has been published
29,450 views
2,288 completions
1,972 likes
Verified by Daniel Hall
Psychologist with 25 years of experience
Share
Scale Explorer

How the Scales are Structured

example score
2/5
Thought Disorder (TD)
Assesses the clinician’s overall impression of the severity of formal thought disturbances.
Low
Moderate
High
01: Low | 23: Moderate | 45: High
A score of 2 indicates a moderate level of thought disorder severity based on observed and reported speech and thinking patterns.
example score
0/2
Bizarre Behavior (BB)
Assesses the clinician’s overall impression of the severity and significance of unusual behavioral disturbances observed during the evaluation.
None
Present
0: None | 12: Present
A score of 0 indicates no unusual behavioral disturbances were observed as clinically significant during the assessment.
example score
0/0
Delusions (D)
Assesses the overall presence and impact of delusional (nonsensical) ideas on the patient’s condition and behavior.
Absent
Present
0: Absent | 0: Present
A score of 0 indicates no observable delusional content or impact was noted on this scale at the time of assessment.
example score
0/0
Hallucinations (H)
This scale rates the clinician’s overall impression of the severity and clinical significance of hallucination-related symptoms based on interview and observation.
None
Not applicable
0: None | 0: Not applicable
A score of 0 indicates no hallucinatory symptoms were observed or reported as clinically significant during the assessment.
example score
13/20
Total Summary Score (TSS)
This scale reflects the clinician’s overall judgment of the severity of positive symptoms based on observed and reported manifestations.
Low
Moderate
High
06: Low | 713: Moderate | 1420: High
A score of 13 falls in the Moderate range, indicating a clinician-rated moderate overall severity of positive symptoms.
example score
92/150
Subtotal Score (SS)
This scale sums SAPS intermediate ratings to quantify the overall severity of observed positive symptoms.
Low
Moderate
High
050: Low | 51100: Moderate | 101150: High
A total score of 92 falls in the Moderate range, indicating a moderately elevated overall severity of positive symptoms on the summed SAPS ratings.
example score
19/40
Thought Disorder (TD)
Assesses the severity of positive thought disorder symptoms reflected in disorganized speech and disturbed associations.
Low
Moderate
High
013: Low | 1426: Moderate | 2740: High
A score of 19 falls in the Moderate range, suggesting noticeable but not extreme disturbances in speech coherence and associative processes during assessment.
example score
7/20
Bizarre Behavior (BB)
Assesses the severity of strange, extravagant, or absurd behaviors not attributable to psychoactive substance use.
Low
Moderate
High
06: Low | 713: Moderate | 1420: High
A score of 7 falls in the Moderate range, indicating noticeable but not severe unusual behavior that may affect functioning or interaction.
example score
12/60
Delusions (D)
Assesses the severity and functional impact of delusional (nonsensical) beliefs on thinking and behavior.
Low
Moderate
High
019: Low | 2039: Moderate | 4060: High
A score of 12 falls in the Low range, suggesting delusional symptoms are present to a limited degree with relatively minor impact on thinking and behavior.
example score
10/30
Hallucinations (H)
Measures the severity of hallucinatory experiences across different sensory modalities based on interview and observation.
None/Minimal
Moderate
Marked/Severe
09: None/Minimal | 1019: Moderate | 2030: Marked/Severe
A score of 10 falls in the Moderate range, suggesting noticeable hallucinatory symptoms that are present but not at the most intense end of the scale.
example score
121/170
Total Score (TS)
The SAPS Total score summarizes the overall severity of observed positive symptoms such as hallucinations, delusions, disorganized speech/behavior, and unusual motor behavior.
Low
Moderate
High
056: Low | 57113: Moderate | 114170: High
A total score of 121 falls in the High range, indicating a high overall severity of positive symptom manifestations on this assessment.
Start Online Test
just completed the test
DATA-BASED USER COHORTS

Who Usually Takes This Test?

Psychiatrists and residents
46%OF USERS
Use it in clinical interviews to rate hallucinations, delusions, and disorganization and track changes over time.
Inpatient unit clinicians
34%OF USERS
Apply it on wards to document observable positive symptoms and support treatment planning and handoffs.
Clinical psychologists in psychosis care
20%OF USERS
Use it as a structured way to quantify positive symptoms during assessment and monitor response to therapy.
BASED ON AGGREGATED, ANONYMIZED DATA FROM TENS OF THOUSANDS OF FREUDLY USERS.
Benchmarking

See How You Compare

Once you complete the test, your results are compared with real-world data from people in your country.
Below is a preview of how scores are typically distributed across each scale.
Thinking disorders (Td)
Average
1.4
Normal range
0.72
min.
0
max.
5
This curve shows how scores are typically distributed.
Once you complete the test, your result will appear on the scale so you can see how you compare.
Unusual behavior (Ub)
Average
1.2
Normal range
0.91.4
min.
0
max.
2
This curve shows how scores are typically distributed.
Once you complete the test, your result will appear on the scale so you can see how you compare.
Nonsense (N)
Nonsense (N)
Average
0
Normal range
00
min.
0
max.
0
This curve shows how scores are typically distributed.
Once you complete the test, your result will appear on the scale so you can see how you compare.
Hallucinations (H)
Hallucinations (H)
Average
0
Normal range
00
min.
0
max.
0
This curve shows how scores are typically distributed.
Once you complete the test, your result will appear on the scale so you can see how you compare.
Total of the generalized scores (Totgs)
Average
9.7
Normal range
6.413
min.
0
max.
20
This curve shows how scores are typically distributed.
Once you complete the test, your result will appear on the scale so you can see how you compare.
Sum of intermediate scores (Sois)
Average
41.7
Normal range
21.561.9
min.
0
max.
150
This curve shows how scores are typically distributed.
Once you complete the test, your result will appear on the scale so you can see how you compare.
Thought Disorders (TD)
Average
24.2
Normal range
18.130.4
min.
0
max.
40
This curve shows how scores are typically distributed.
Once you complete the test, your result will appear on the scale so you can see how you compare.
Unusual behavior (Ub)
Average
14.9
Normal range
1217.8
min.
0
max.
20
This curve shows how scores are typically distributed.
Once you complete the test, your result will appear on the scale so you can see how you compare.
Nonsense (N)
Nonsense (N)
Average
28.6
Normal range
20.236.9
min.
0
max.
60
This curve shows how scores are typically distributed.
Once you complete the test, your result will appear on the scale so you can see how you compare.
Hallucinations (H)
Hallucinations (H)
Average
15
Normal range
11.118.9
min.
0
max.
30
This curve shows how scores are typically distributed.
Once you complete the test, your result will appear on the scale so you can see how you compare.
Total score (Ts)
Total score (Ts)
Average
96.9
Normal range
67.5126.2
min.
0
max.
170
This curve shows how scores are typically distributed.
Once you complete the test, your result will appear on the scale so you can see how you compare.
Featured On
SAMPLE QUESTIONS

Example Questions From the Test

Symptom ratings should be completed by one, or preferably two, experienced raters who are thoroughly familiar with the scale’s glossary. To minimize the influence of circadian factors on scoring, ratings should be conducted at the same time of day, preferably in the morning, immediately after breakfast.
    • Absent
    • Questionable pathology
    • Mild – commentary occurred once or twice
    • Moderate – commentary voices occur at least once a week
    • Marked – frequent occurrence of commentary voices
    • Severe – daily voices with a commentary content
    • Absent
    • Questionable
    • Mild – the phenomenon has occurred at least once
    • Moderate – the phenomenon occurs at least once a week
    • Marked – frequent somatic or tactile hallucinations
    • Severe – daily somatic or tactile hallucinations
    • absent
    • questionable pathology
    • mild – the phenomenon occurs at least once
    • moderate – visual hallucinations occur at least once a week
    • marked – frequent visual hallucinations
    • severe – daily visual hallucinations
WHAT THE TEST MEASURES
About This Assessment
Scale for Assessing Positive Symptoms, SAPS Test

Scale for the Assessment of Positive Symptoms (SAPS) Test - Symptoms and Signs

psychopathology
schizophrenia

This clinician-rated instrument is used to quantify the severity of positive psychotic symptoms through interview and behavioral observation. The Scale for the Assessment of Positive Symptoms (SAPS) provides a structured approach to documenting symptom presence and intensity in domains commonly associated with psychosis.

The measure includes 34 items and typically requires about 7 minutes to administer and score, depending on clinical complexity and the amount of collateral information available. It is commonly used in clinical and research settings to support baseline characterization and longitudinal monitoring of symptom change; the original measure was developed by Nancy C. Andreasen.

The Scale for the Assessment of Positive Symptoms (SAPS) is intended to complement broader diagnostic and clinical evaluation rather than function as a stand-alone diagnostic tool, and interpretation should be integrated with the full clinical picture, including mental status findings and relevant history.

Author: Nancy C. Andreasen
Literature: Andreasen, N. C. Scale for the assessment of positive symptoms (SAPS). University of Iowa. 1984.; Kay, S. R., Fiszbein, A., & Opler, L. A. The positive and negative syndrome scale (PANSS) for schizophrenia. Schizophrenia Bulletin. 1987.
Popular tests
Comments
Leave a Comment