
Statistics Quiz
How the Scales are Structured
Who Usually Takes This Test?
See How You Compare
Below is a preview of how scores are typically distributed across each scale.
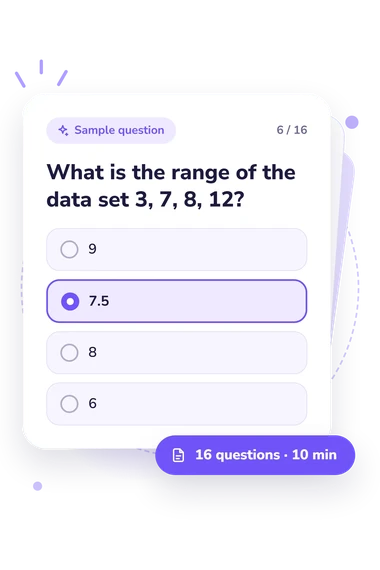
Example Questions From the Test
- The distribution must have a small mean
- The observations tend to cluster close to the mean
- Most observations are categorical rather than numerical
- The sample necessarily represents the population well
- The 200 surveyed students
- All 8,000 university students
- Every university student in the country
- Only the surveyed students who completed every question
- 9
- 5
- 8
- 6
Statistics Quiz - Description and methodology of the test
Students, teachers, and independent learners who want to check their grasp of introductory concepts can use this statistics quiz as a focused knowledge check. It is intended for anyone reviewing whether ideas such as sampling, probability, averages, variability, and inference are understood well enough to apply in familiar examples. Presented as a statistics online quiz, it can also help identify topics that deserve more study or practice.
What This Assessment Explores
Rather than measuring one formula skill, the questionnaire samples reasoning used in common statistical situations. Items address typical values in skewed data, spread, variable types, samples and populations, probability, association and causation, p-values, confidence intervals, random assignment, random sampling, and graph selection. A stats quiz with this range suits learners seeking a broad check of introductory understanding rather than a score on one technique.
The themes contributing to the result are:
- Descriptive statistics shows whether you can interpret averages and measures of spread.
- Probability and conditional reasoning indicates how you evaluate simple events and dependent probabilities.
- Sampling and study design reflects your grasp of samples, populations, selection, assignment, and causal comparison.
- Inference and interpretation tests whether you distinguish p-values and confidence intervals from certainty.
- Data representation checks whether you can match a graph or variable type to the information.
Methodology and Scientific Basis
Each item uses a short scenario or definition followed by four answer choices. This conceptual multiple-choice format asks you to select the best interpretation, calculation, or design principle, so performance depends on reasoning as well as recognition of basic terms. The result is reported as one overall Statistics Knowledge score from 0-16: Foundations to build (0-6) signals a need to reinforce core ideas; Developing knowledge (7-12) shows many concepts are understood but application can grow; Strong knowledge (13-16) reflects solid introductory command.
The content is conceptually consistent with CAOS (delMas et al., 2007), which assesses conceptual understanding in introductory statistics, and with Garfield’s account of statistical reasoning. The questionnaire is not a direct adaptation or standardized administration of either source, so those publications do not establish its norms, reliability, or validity.
As a statistics-focused quiz with answers to choose from, it can indicate topics for review, but the result is a snapshot rather than a complete measure of statistical ability. Guessing, prior coursework, wording familiarity, and momentary concentration can affect performance. Use the band to guide further practice and compare it with tasks requiring explanation, calculation, and data analysis.
- delMas, Robert; Garfield, Joan; Ooms, Ann; Chance, Beth. (2007). Assessing Students' Conceptual Understanding after a First Course in Statistics. Statistics Education Research Journal, 6(2), 28-58. 10.52041/serj.v6i2.483
- Garfield, Joan B. (2003). Assessing Statistical Reasoning. Statistics Education Research Journal, 2(1), 22-38. 10.52041/serj.v2i1.557