
Supply and Demand Quiz
How the Scales are Structured
Who Usually Takes This Test?
See How You Compare
Below is a preview of how scores are typically distributed across each scale.
Example Questions From the Test
- Scarcity
- A demand shift
- A surplus
- A shortage
- The supply of restaurant meals shifts left.
- The quantity demanded falls along the existing demand curve.
- The demand for restaurant meals shifts right.
- The demand for restaurant meals shifts left.
- A surplus of 200 tickets
- An equilibrium quantity of 1,600 tickets
- A shortage of 200 tickets
- A demand decrease of 200 tickets
Supply and Demand Quiz - Description and methodology of the test
Students, instructors, and curious learners can use this supply and demand quiz to test whether they can reason through changing market conditions rather than recall isolated definitions. It also works as a microeconomics quiz on supply and demand for checking how well graphs, prices, quantities, and policy effects fit together. The result indicates overall conceptual command and whether broader review of supply, demand, equilibrium, elasticity, and interventions may help.
What This Assessment Measures
The changing-market questions give learners practice applying economic relationships in this supply and demand practice quiz. They test how prices, costs, related goods, taxes, and controls affect demand, supply, equilibrium, and outcomes. Respondents decide whether a curve shifts, quantity moves along it, or a shortage or surplus appears.
Four connected areas organize this reasoning:
- Demand and supply shifts show how outside conditions alter planned buying or selling.
- Equilibrium analysis explains how market price and quantity respond to change.
- Elasticity reasoning indicates how strongly quantity demanded reacts to price.
- Market interventions reveal effects of ceilings, floors, and per-unit taxes.
The result appears on the Supply and Demand Knowledge scale: 0-16, with Foundations to build (0-6), Developing knowledge (7-12), or Strong command (13-16). These bands show whether graph logic needs reinforcement, application needs practice, or concepts are handled consistently.
Methodology and Scientific Basis
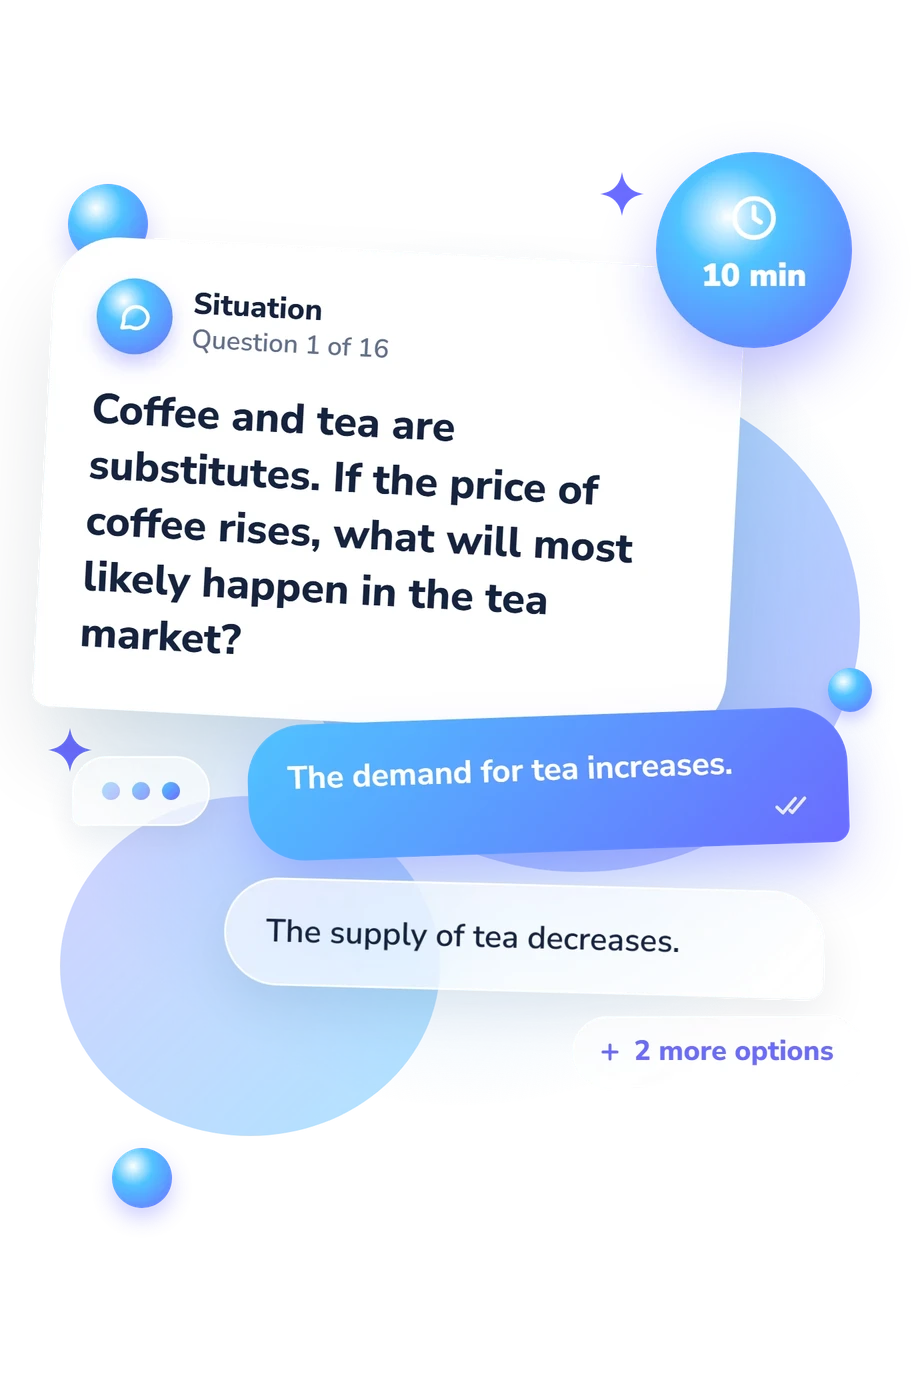
Each item presents a short scenario with four answer choices. The respondent selects the option that follows from conditions such as a change in a substitute’s price, a production cost, or a binding control. This format tests applied reasoning across graphs and verbal descriptions, not extended calculation.
Scoring is reported as a total with a level band; no norm-based percentile or clinical threshold is supplied. As a supply and demand test, it is a snapshot of conceptual performance rather than a complete measure of economic proficiency.
The item logic is conceptually consistent with the introductory framework described by Shapiro et al. (2022), with parallel explanations in Mankiw (2021) and the classical treatment associated with Alfred Marshall. The questionnaire is not an adaptation of those publications; they supply a framework for the concepts represented by its scenarios. Schmidtz (2015) also discusses the economic effects of price ceilings and floors.
Because it has no stated standardization data, scores should be read cautiously. Performance can reflect recent study, familiarity with diagrams, attention, and interpretation of each scenario, so targeted review is more useful than treating one total as a fixed ability label.
- Shapiro, David, Daniel MacDonald, and Steven A. Greenlaw. Principles of Microeconomics 3e. Houston, TX: OpenStax, 2022.
- Mankiw, N. Gregory. Principles of Microeconomics, 9th ed. Boston, MA: Cengage Learning, 2021.
- Marshall, Alfred. Principles of Economics: An Introductory Volume, 8th ed. London: Macmillan and Co., Limited, 1920.
- Schmidtz, David. “Are Price Controls Fair?” Supreme Court Economic Review 23 (2015): 221-233. 10.1086/686479
Updated: